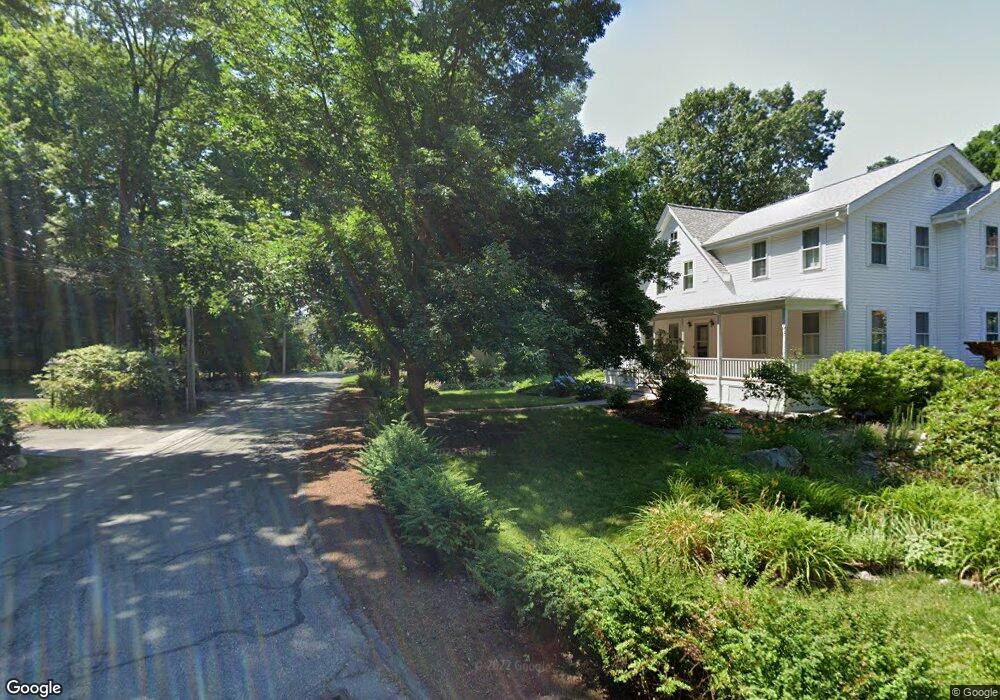
44 Curve St Wellesley, MA 02482
Wellesley Square NeighborhoodEstimated Value: $1,490,000 - $1,600,000
4
Beds
3
Baths
2,185
Sq Ft
$718/Sq Ft
Est. Value
About This Home
This home is located at 44 Curve St, Wellesley, MA 02482 and is currently estimated at $1,567,771, approximately $717 per square foot. 44 Curve St is a home located in Norfolk County with nearby schools including Sprague Elementary School, Wellesley Middle School, and Wellesley Sr High School.
Ownership History
Date
Name
Owned For
Owner Type
Purchase Details
Closed on
Jun 20, 2005
Sold by
Haas Signe J
Bought by
Cator Johnny and Croke Stephanie J
Current Estimated Value
Home Financials for this Owner
Home Financials are based on the most recent Mortgage that was taken out on this home.
Original Mortgage
$359,650
Outstanding Balance
$188,001
Interest Rate
5.78%
Mortgage Type
Purchase Money Mortgage
Estimated Equity
$1,379,770
Purchase Details
Closed on
Aug 6, 1997
Sold by
Gerardin Robert J and Gerardin Marie C
Bought by
Hass Signe J
Home Financials for this Owner
Home Financials are based on the most recent Mortgage that was taken out on this home.
Original Mortgage
$250,000
Interest Rate
7.5%
Mortgage Type
Purchase Money Mortgage
Purchase Details
Closed on
Apr 27, 1990
Sold by
Daunt Carol M
Bought by
Gerardin Robert J
Create a Home Valuation Report for This Property
The Home Valuation Report is an in-depth analysis detailing your home's value as well as a comparison with similar homes in the area
Home Values in the Area
Average Home Value in this Area
Purchase History
| Date | Buyer | Sale Price | Title Company |
|---|---|---|---|
| Cator Johnny | $870,000 | -- | |
| Hass Signe J | $452,000 | -- | |
| Gerardin Robert J | $185,000 | -- |
Source: Public Records
Mortgage History
| Date | Status | Borrower | Loan Amount |
|---|---|---|---|
| Open | Cator Johnny | $359,650 | |
| Closed | Cator Johnny | $140,000 | |
| Previous Owner | Gerardin Robert J | $250,000 | |
| Previous Owner | Gerardin Robert J | $22,000 |
Source: Public Records
Tax History Compared to Growth
Tax History
| Year | Tax Paid | Tax Assessment Tax Assessment Total Assessment is a certain percentage of the fair market value that is determined by local assessors to be the total taxable value of land and additions on the property. | Land | Improvement |
|---|---|---|---|---|
| 2025 | $13,744 | $1,337,000 | $957,000 | $380,000 |
| 2024 | $12,867 | $1,236,000 | $870,000 | $366,000 |
| 2023 | $12,194 | $1,065,000 | $771,000 | $294,000 |
| 2022 | $12,217 | $1,046,000 | $662,000 | $384,000 |
| 2021 | $11,926 | $1,015,000 | $633,000 | $382,000 |
| 2020 | $10,427 | $902,000 | $633,000 | $269,000 |
| 2019 | $10,101 | $873,000 | $604,000 | $269,000 |
| 2018 | $9,799 | $820,000 | $590,000 | $230,000 |
| 2017 | $9,668 | $820,000 | $590,000 | $230,000 |
| 2016 | $9,476 | $801,000 | $580,000 | $221,000 |
| 2015 | $8,416 | $728,000 | $543,000 | $185,000 |
Source: Public Records
Map
Nearby Homes
- 148 Weston Rd Unit 208
- 148 Weston Rd Unit 207
- 68 Linden St Unit 68
- 63 Linden St Unit 1
- 26B Pleasant St Unit B
- 100 Linden St Unit 111
- 100 Linden St Unit 103
- 100 Linden St Unit 303
- 100 Linden St Unit 105
- 16 Oak St
- 5 Abbott St
- 11 Oak St Unit 62
- 16 Stearns Rd Unit 101
- 16 Stearns Rd Unit 302
- 16 Stearns Rd Unit 207
- 16 Stearns Rd Unit 301
- 16 Stearns Rd Unit 103
- 16 Stearns Rd Unit 202
- 16 Stearns Rd Unit 304
- 16 Stearns Rd Unit 104