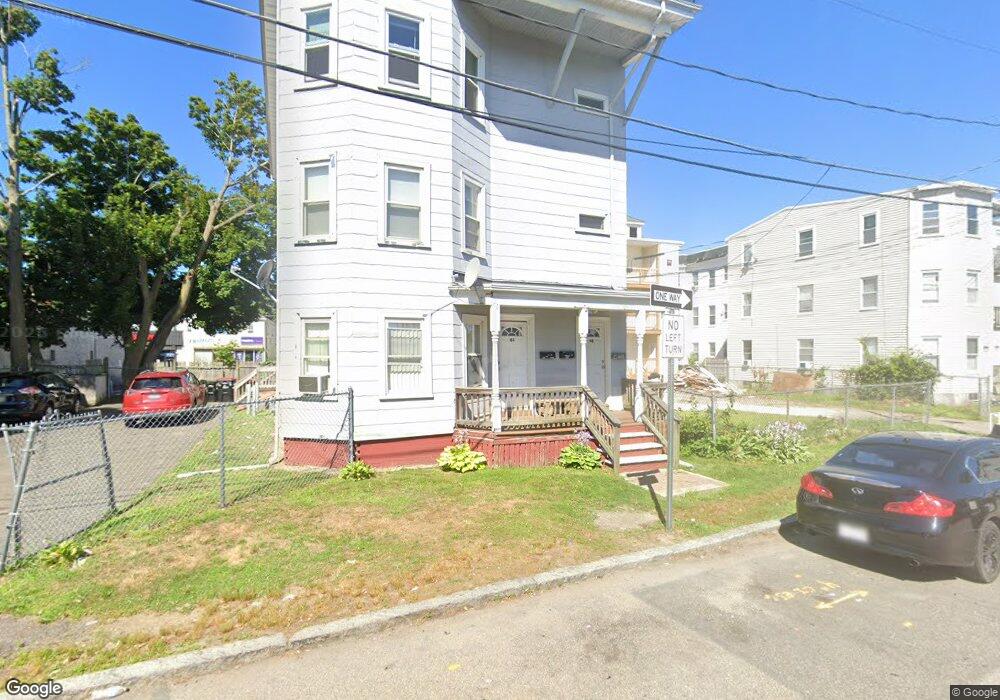
44 E Main St Brockton, MA 02301
Montello NeighborhoodEstimated Value: $488,545 - $825,000
6
Beds
3
Baths
3,522
Sq Ft
$203/Sq Ft
Est. Value
About This Home
This home is located at 44 E Main St, Brockton, MA 02301 and is currently estimated at $714,386, approximately $202 per square foot. 44 E Main St is a home located in Plymouth County with nearby schools including Louis F Angelo Elementary School, Raymond K-8 Elementary School, and Manthala George Jr. School.
Ownership History
Date
Name
Owned For
Owner Type
Purchase Details
Closed on
Jun 23, 2025
Sold by
Galligan Sean P
Bought by
44 East Main St Rt and Galligan
Current Estimated Value
Purchase Details
Closed on
Mar 28, 2024
Sold by
Bethel Bridgette
Bought by
Galligan Sean P
Home Financials for this Owner
Home Financials are based on the most recent Mortgage that was taken out on this home.
Original Mortgage
$345,000
Interest Rate
7.13%
Mortgage Type
Purchase Money Mortgage
Purchase Details
Closed on
May 14, 2001
Sold by
Mel Ton Rt and Dilillo
Bought by
Bethel Bridgette
Create a Home Valuation Report for This Property
The Home Valuation Report is an in-depth analysis detailing your home's value as well as a comparison with similar homes in the area
Home Values in the Area
Average Home Value in this Area
Purchase History
| Date | Buyer | Sale Price | Title Company |
|---|---|---|---|
| 44 East Main St Rt | -- | -- | |
| Galligan Sean P | $460,000 | None Available | |
| Bethel Bridgette | $180,000 | -- | |
| Bethel Bridgette | $180,000 | -- |
Source: Public Records
Mortgage History
| Date | Status | Borrower | Loan Amount |
|---|---|---|---|
| Previous Owner | Galligan Sean P | $345,000 | |
| Previous Owner | Bethel Bridgette | $210,000 | |
| Previous Owner | Bethel Bridgette | $224,000 | |
| Previous Owner | Bethel Bridgette | $181,500 |
Source: Public Records
Tax History
| Year | Tax Paid | Tax Assessment Tax Assessment Total Assessment is a certain percentage of the fair market value that is determined by local assessors to be the total taxable value of land and additions on the property. | Land | Improvement |
|---|---|---|---|---|
| 2025 | $8,398 | $693,500 | $133,900 | $559,600 |
| 2024 | $8,362 | $695,700 | $133,900 | $561,800 |
| 2023 | $7,371 | $567,900 | $100,700 | $467,200 |
| 2022 | $7,209 | $516,000 | $91,200 | $424,800 |
| 2021 | $6,540 | $453,300 | $75,200 | $378,100 |
| 2020 | $6,483 | $392,500 | $71,200 | $321,300 |
| 2019 | $6,250 | $402,200 | $68,400 | $333,800 |
| 2018 | $5,578 | $347,300 | $68,400 | $278,900 |
| 2017 | $5,849 | $331,000 | $68,400 | $262,600 |
| 2016 | $4,991 | $287,500 | $66,300 | $221,200 |
| 2015 | $3,915 | $215,700 | $66,300 | $149,400 |
| 2014 | $3,599 | $198,500 | $66,300 | $132,200 |
Source: Public Records
Map
Nearby Homes
- 45 E Main St
- 45 E Main St Unit 3
- 50 E Main St
- 34 E Main St Unit 2 South
- 34 E Main St Unit 2 North
- 34 E Main St
- 587 N Main St
- 41 E Main St
- 567 N Main St
- 35 E Main St
- 49 E Main St
- 591 N Main St
- 55 E Main St
- 26 E Battles St
- 578 N Main St
- 61 E Main St
- 582 N Main St
- 574 N Main St
- 574 N Main St Unit 1
- 29 E Main St
Your Personal Tour Guide
Ask me questions while you tour the home.