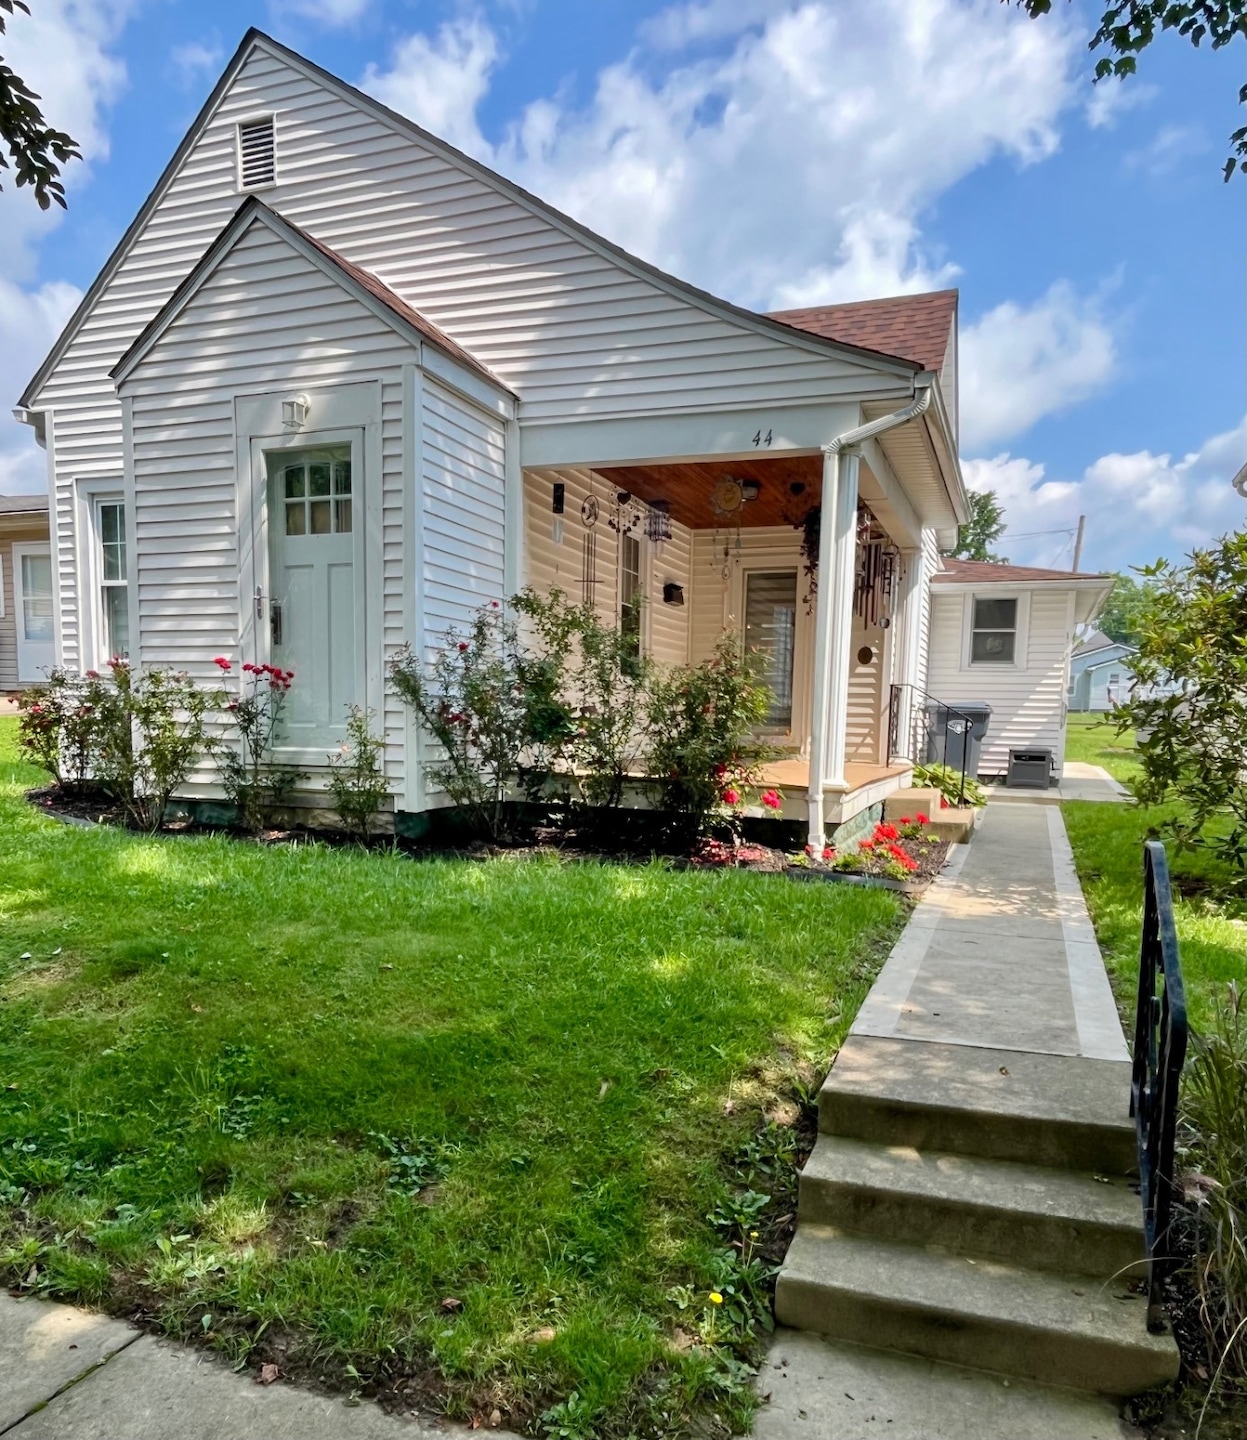


44 E Vine St Jackson, OH 45640
Estimated payment $1,234/month
Highlights
- Open Floorplan
- Cottage
- 1 Car Detached Garage
- 1 Fireplace
- Covered Patio or Porch
- Living Room
About This Home
Come see all the updates that have been completed on this one story home . A MUST SEE to Appreciate - approximately 10 Ft high ceilings throughout. The floors have waterproof plank flooring through out . The subfloors were replaced and the partial basement was encapsulated. The detached garage offers a workshop area and has new metal on exterior . The sidewalks and off street parking are new. The kitchen has all new cabinets and backsplash. The home has new light fixtures and has been freshly painted . New refrigerator ,range and window treatments will remain with the home . The lot is a 43' x 140' and is flat and easy to mow . This home offers a large dining room with built ins. There is a decorative fireplace in one bedroom. Call today for your appointment.
Home Details
Home Type
- Single Family
Est. Annual Taxes
- $755
Year Renovated
- 2023
Parking
- 1 Car Detached Garage
Home Design
- Cottage
- Frame Construction
- Asphalt Roof
- Vinyl Siding
Interior Spaces
- 1,164 Sq Ft Home
- 1-Story Property
- Open Floorplan
- 1 Fireplace
- Living Room
- Dining Room
- Unfinished Basement
- Partial Basement
- Oven
- Laundry Room
Bedrooms and Bathrooms
- 3 Bedrooms
- 1 Full Bathroom
Utilities
- Forced Air Heating and Cooling System
- Heating System Uses Natural Gas
Additional Features
- Covered Patio or Porch
- 6,020 Sq Ft Lot
Map
Home Values in the Area
Average Home Value in this Area
Tax History
| Year | Tax Paid | Tax Assessment Tax Assessment Total Assessment is a certain percentage of the fair market value that is determined by local assessors to be the total taxable value of land and additions on the property. | Land | Improvement |
|---|---|---|---|---|
| 2025 | $888 | $24,720 | $1,950 | $22,770 |
| 2024 | $742 | $20,480 | $1,950 | $18,530 |
| 2023 | $755 | $20,480 | $1,950 | $18,530 |
| 2022 | $989 | $19,390 | $1,830 | $17,560 |
| 2021 | $423 | $19,390 | $1,830 | $17,560 |
| 2020 | $210 | $19,390 | $1,830 | $17,560 |
| 2019 | $339 | $17,160 | $1,620 | $15,540 |
| 2018 | $326 | $17,160 | $1,620 | $15,540 |
| 2017 | $337 | $17,160 | $1,620 | $15,540 |
| 2016 | $337 | $17,720 | $1,620 | $16,100 |
| 2015 | $309 | $17,720 | $1,620 | $16,100 |
| 2013 | $309 | $16,950 | $1,620 | $15,330 |
| 2012 | $313 | $16,950 | $1,620 | $15,330 |
Property History
| Date | Event | Price | List to Sale | Price per Sq Ft |
|---|---|---|---|---|
| 01/19/2026 01/19/26 | For Sale | $219,000 | 0.0% | $188 / Sq Ft |
| 12/12/2025 12/12/25 | Off Market | $219,000 | -- | -- |
| 07/16/2025 07/16/25 | Price Changed | $219,000 | -8.4% | $188 / Sq Ft |
| 06/16/2025 06/16/25 | For Sale | $239,000 | -- | $205 / Sq Ft |
Purchase History
| Date | Type | Sale Price | Title Company |
|---|---|---|---|
| Deed | $139,900 | -- | |
| Warranty Deed | $125 | -- |
Mortgage History
| Date | Status | Loan Amount | Loan Type |
|---|---|---|---|
| Closed | -- | No Value Available | |
| Open | $135,703 | New Conventional |
Source: My State MLS
MLS Number: 11518143
APN: H14-002-00-158-00
- 15 Orchard Ln
- 312 S Arkansas Ave
- 710 Pennsylvania Ave
- 634 Meadow Ct
- 77 Morgan Dr
- 430 Dewey St Unit 6
- 46 S Hickory St Unit 46
- 241 W Water St Unit SI ID1265609P
- 241 W Water St Unit SI ID1265644P
- 241 W Water St Unit SI ID1265607P
- 402 W Main St
- 547 Plyleys Ln
- 596 W 5th St
- 102 Walnut Hills Dr
- 1355 Western Ave
- 1920 Hutchins St
- 1921 18th St
- 767 Hopetown Rd
- 930 4th St Unit B

Ask me questions while you tour the home.