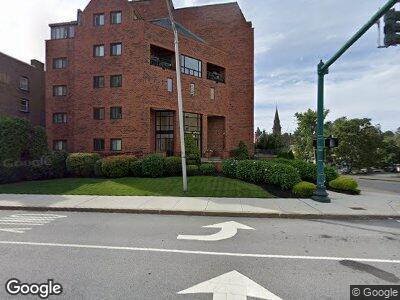
Lynden House 44 Elm St Unit 405 Worcester, MA 01609
Downtown Worcester NeighborhoodEstimated Value: $249,000 - $279,000
1
Bed
1
Bath
790
Sq Ft
$340/Sq Ft
Est. Value
About This Home
This home is located at 44 Elm St Unit 405, Worcester, MA 01609 and is currently estimated at $268,244, approximately $339 per square foot. 44 Elm St Unit 405 is a home located in Worcester County with nearby schools including Jacob Hiatt Magnet School, Chandler Magnet, and Elm Park Elementary School.
Ownership History
Date
Name
Owned For
Owner Type
Purchase Details
Closed on
Feb 27, 2002
Sold by
Elm Linden Dev T and Peters R Norman
Bought by
Joseph Ross A
Current Estimated Value
Home Financials for this Owner
Home Financials are based on the most recent Mortgage that was taken out on this home.
Original Mortgage
$99,750
Interest Rate
6.85%
Mortgage Type
Purchase Money Mortgage
Create a Home Valuation Report for This Property
The Home Valuation Report is an in-depth analysis detailing your home's value as well as a comparison with similar homes in the area
Home Values in the Area
Average Home Value in this Area
Purchase History
| Date | Buyer | Sale Price | Title Company |
|---|---|---|---|
| Joseph Ross A | $105,000 | -- |
Source: Public Records
Mortgage History
| Date | Status | Borrower | Loan Amount |
|---|---|---|---|
| Open | Joseph Ross A | $101,000 | |
| Closed | Joseph Ross A | $99,750 |
Source: Public Records
Tax History Compared to Growth
Tax History
| Year | Tax Paid | Tax Assessment Tax Assessment Total Assessment is a certain percentage of the fair market value that is determined by local assessors to be the total taxable value of land and additions on the property. | Land | Improvement |
|---|---|---|---|---|
| 2025 | $2,911 | $220,700 | $0 | $220,700 |
| 2024 | $2,996 | $217,900 | $0 | $217,900 |
| 2023 | $2,705 | $188,600 | $0 | $188,600 |
| 2022 | $2,493 | $163,900 | $0 | $163,900 |
| 2021 | $2,333 | $143,300 | $0 | $143,300 |
| 2020 | $2,247 | $132,200 | $0 | $132,200 |
| 2019 | $2,299 | $127,700 | $0 | $127,700 |
| 2018 | $2,250 | $119,000 | $0 | $119,000 |
| 2017 | $2,233 | $116,200 | $0 | $116,200 |
| 2016 | $2,277 | $110,500 | $0 | $110,500 |
| 2015 | $2,218 | $110,500 | $0 | $110,500 |
| 2014 | $2,216 | $113,400 | $0 | $113,400 |
Source: Public Records
About Lynden House
Map
Nearby Homes
- 31 Chestnut St Unit 2
- 21 John St
- 12 John St
- 38 1/2 Bowdoin St
- 76 Elm St
- 78 Elm St
- 241 Pleasant St
- 11 Home St
- 21 Fruit St
- 70 Southbridge St Unit 714
- 70 Southbridge St Unit 915
- 5 State St Unit 3
- 26 Elbridge St
- 385 Pleasant St
- 146 -152 Chandler
- 47 Piedmont St
- 46 Townsend St
- 8 Pond St
- 70 Mount Carmel Way
- 80 Salisbury St Unit 410