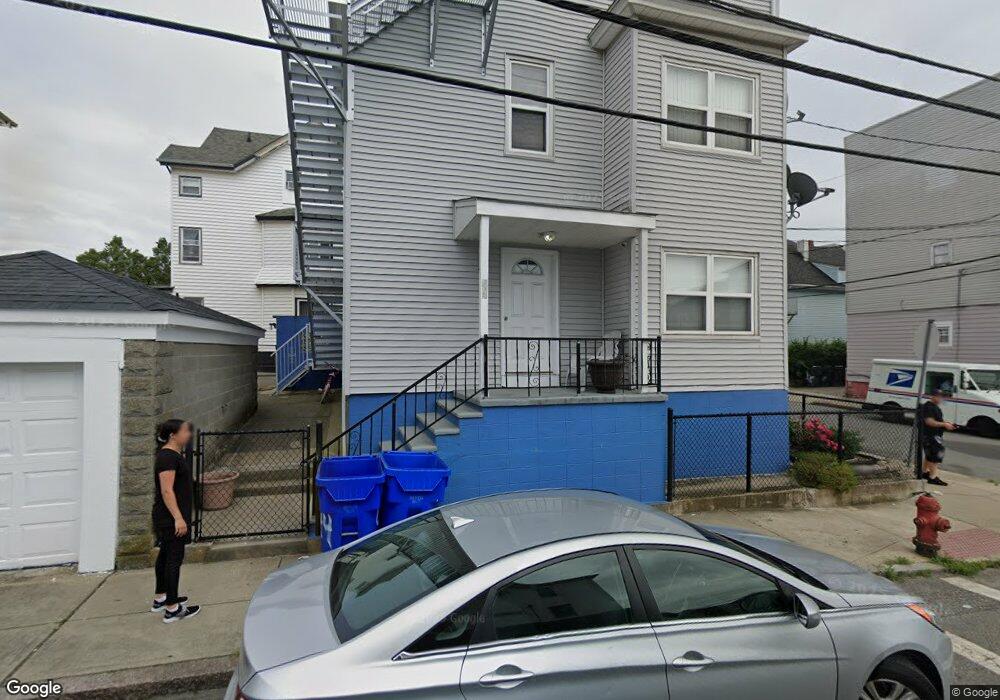
44 Flint St Fall River, MA 02723
Flint NeighborhoodEstimated Value: $425,431 - $612,000
9
Beds
3
Baths
2,989
Sq Ft
$187/Sq Ft
Est. Value
About This Home
This home is located at 44 Flint St, Fall River, MA 02723 and is currently estimated at $558,858, approximately $186 per square foot. 44 Flint St is a home located in Bristol County with nearby schools including Mary Fonseca Elementary School, Talbot Innovation School, and B M C Durfee High School.
Ownership History
Date
Name
Owned For
Owner Type
Purchase Details
Closed on
Nov 3, 2017
Sold by
Sarmento Alfred S
Bought by
Sarmento Maria H
Current Estimated Value
Purchase Details
Closed on
Dec 4, 1990
Sold by
Stpierre Roger H
Bought by
Sarmento Alfred S
Home Financials for this Owner
Home Financials are based on the most recent Mortgage that was taken out on this home.
Original Mortgage
$90,000
Interest Rate
10.16%
Mortgage Type
Purchase Money Mortgage
Create a Home Valuation Report for This Property
The Home Valuation Report is an in-depth analysis detailing your home's value as well as a comparison with similar homes in the area
Home Values in the Area
Average Home Value in this Area
Purchase History
| Date | Buyer | Sale Price | Title Company |
|---|---|---|---|
| Sarmento Maria H | -- | -- | |
| Sarmento Alfred S | $100,000 | -- | |
| Sarmento Alfred S | $100,000 | -- |
Source: Public Records
Mortgage History
| Date | Status | Borrower | Loan Amount |
|---|---|---|---|
| Previous Owner | Sarmento Alfred S | $90,000 |
Source: Public Records
Tax History
| Year | Tax Paid | Tax Assessment Tax Assessment Total Assessment is a certain percentage of the fair market value that is determined by local assessors to be the total taxable value of land and additions on the property. | Land | Improvement |
|---|---|---|---|---|
| 2025 | $4,826 | $421,500 | $100,100 | $321,400 |
| 2024 | $4,588 | $399,300 | $93,500 | $305,800 |
| 2023 | $4,005 | $326,400 | $78,400 | $248,000 |
| 2022 | $3,579 | $283,600 | $74,700 | $208,900 |
| 2021 | $3,293 | $238,100 | $71,400 | $166,700 |
| 2020 | $2,972 | $205,700 | $69,100 | $136,600 |
| 2019 | $2,824 | $193,700 | $69,100 | $124,600 |
| 2018 | $2,648 | $181,100 | $73,200 | $107,900 |
| 2017 | $2,535 | $181,100 | $73,200 | $107,900 |
| 2016 | $2,656 | $194,900 | $89,600 | $105,300 |
| 2015 | $2,505 | $191,500 | $86,200 | $105,300 |
| 2014 | $2,651 | $210,700 | $95,700 | $115,000 |
Source: Public Records
Map
Nearby Homes
- 70 Jencks St
- 88 Harrison St Unit 5
- 1244 Pleasant St
- 178 Thomas St
- 1155-1157 Pleasant St
- 129 County St
- 165 Eastern Ave
- 150 Downing St
- 580 County St
- 152 Alden St
- 25 Lebanon St Unit D
- 25 Lebanon St Unit C
- 529 Eastern Ave
- 10 Carlisa Dr
- 847 Pleasant St
- 31 Choate St
- 139 Quarry St
- 84 Healy St
- 756 County St
- 144 Choate St
- 32 Flint St
- 96 Canonicus St
- 102 Canonicus St
- 64 Flint St
- 64 Canonicus St
- 37 Flint St
- 22 Flint St
- 22 Flint St Unit 2
- 97 Canonicus St
- 62 Canonicus St
- 103 Canonicus St Unit 1
- 69 Jencks St Unit 3
- 69 Jencks St Unit 1
- 69 Jencks St
- 16 Flint St
- 67 Flint St
- 71 Flint St Unit 1
- 313 County St
- 349 County St
- 50 Canonicus St
Your Personal Tour Guide
Ask me questions while you tour the home.