
Seller's Agent in 2026
Nancy Siciliano
Ocean Front Homes
(401) 234-0359
22 in this area
31 Total Sales
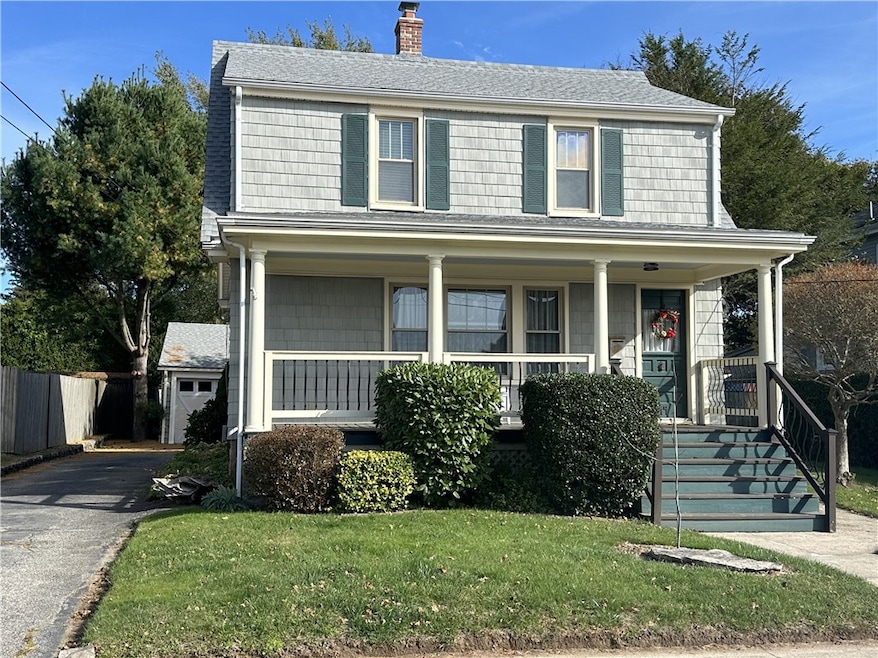
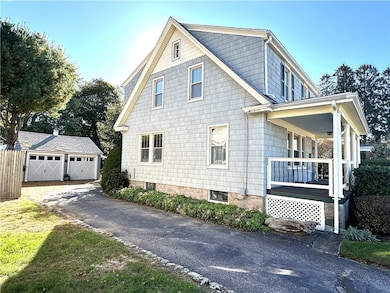
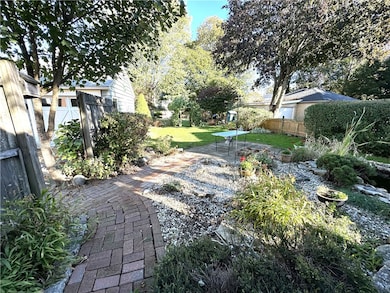
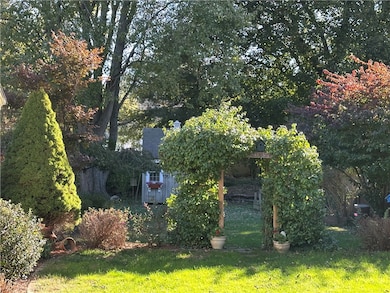
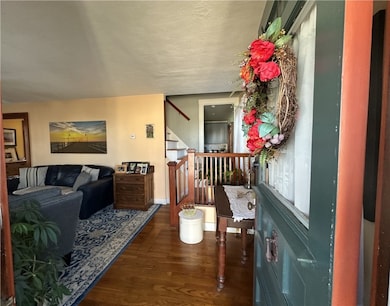
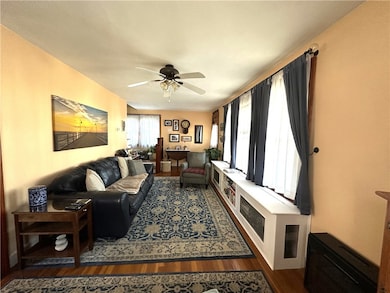
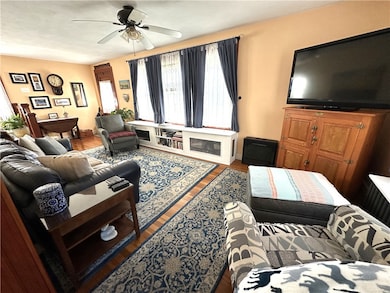
This lovely Colonial home is a short walk to downtown Westerly, and is near area beaches, Historic Watch Hill, golf courses, schools, the train station, the Westerly Airport, and so much more. It is just minutes to Connecticut and the area casinos. Featuring four bedrooms, two updated baths, an updated kitchen, elegant French doors, beautiful windows, a dreamy covered front porch, and a walk-up attic. A full basement, landscaped backyard oasis with a potting shed to enjoy a peaceful time at the end of the day with friends and family, and a two-car garage completes this charming home, just minutes from Misquamicut Beach and Westerly Town Beaches, and so much more.
Last Agent to Sell the Property
Ocean Front Homes License #REB.0017018 Listed on: 10/23/2025
| Date | Type | Sale Price | Title Company |
|---|---|---|---|
| Warranty Deed | $560,000 | -- | |
| Deed | $317,000 | -- | |
| Deed | $317,000 | -- | |
| Deed | $138,000 | -- |
| Date | Status | Loan Amount | Loan Type |
|---|---|---|---|
| Open | $395,290 | New Conventional | |
| Previous Owner | $100,000 | No Value Available | |
| Previous Owner | $117,000 | Purchase Money Mortgage | |
| Previous Owner | $130,720 | Purchase Money Mortgage |
| Date | Event | Price | List to Sale | Price per Sq Ft |
|---|---|---|---|---|
| 01/22/2026 01/22/26 | Sold | $565,000 | 0.0% | $407 / Sq Ft |
| 11/17/2025 11/17/25 | Pending | -- | -- | -- |
| 10/23/2025 10/23/25 | For Sale | $565,000 | -- | $407 / Sq Ft |
| Year | Tax Paid | Tax Assessment Tax Assessment Total Assessment is a certain percentage of the fair market value that is determined by local assessors to be the total taxable value of land and additions on the property. | Land | Improvement |
|---|---|---|---|---|
| 2025 | $3,189 | $409,900 | $160,900 | $249,000 |
| 2024 | $3,176 | $303,900 | $115,400 | $188,500 |
| 2023 | $3,088 | $303,900 | $115,400 | $188,500 |
| 2022 | $3,069 | $303,900 | $115,400 | $188,500 |
| 2021 | $3,118 | $258,500 | $100,500 | $158,000 |
| 2020 | $3,063 | $258,500 | $100,500 | $158,000 |
| 2019 | $3,035 | $258,500 | $100,500 | $158,000 |
| 2018 | $2,920 | $236,400 | $100,500 | $135,900 |
| 2017 | $2,837 | $236,400 | $100,500 | $135,900 |
| 2016 | $2,837 | $236,400 | $100,500 | $135,900 |
| 2015 | $2,715 | $241,800 | $102,500 | $139,300 |
| 2014 | $2,672 | $241,800 | $102,500 | $139,300 |
Seller's Agent in 2026
Nancy Siciliano
Ocean Front Homes
(401) 234-0359
22 in this area
31 Total Sales
Buyer's Agent in 2026
Jessica Gardner
Keller Williams Coastal
(401) 932-4326
8 in this area
57 Total Sales
Source: State-Wide MLS
MLS Number: 1398259
APN: WEST-000077-000143
Disclaimer: Certain information contained herein is derived from information provided by parties other than Homes.com. All information provided is deemed reliable, but is not guaranteed to be accurate and should be independently verified.
![]() IDX information is provided exclusively for personal, non-commercial use, and may not be used for any purpose other than to identify prospective properties consumers may be interested in purchasing. Information is deemed reliable but not guaranteed.
IDX information is provided exclusively for personal, non-commercial use, and may not be used for any purpose other than to identify prospective properties consumers may be interested in purchasing. Information is deemed reliable but not guaranteed.
Copyright © 2026 State-Wide MLS, Inc. All rights reserved.
Ask me questions while you tour the home.