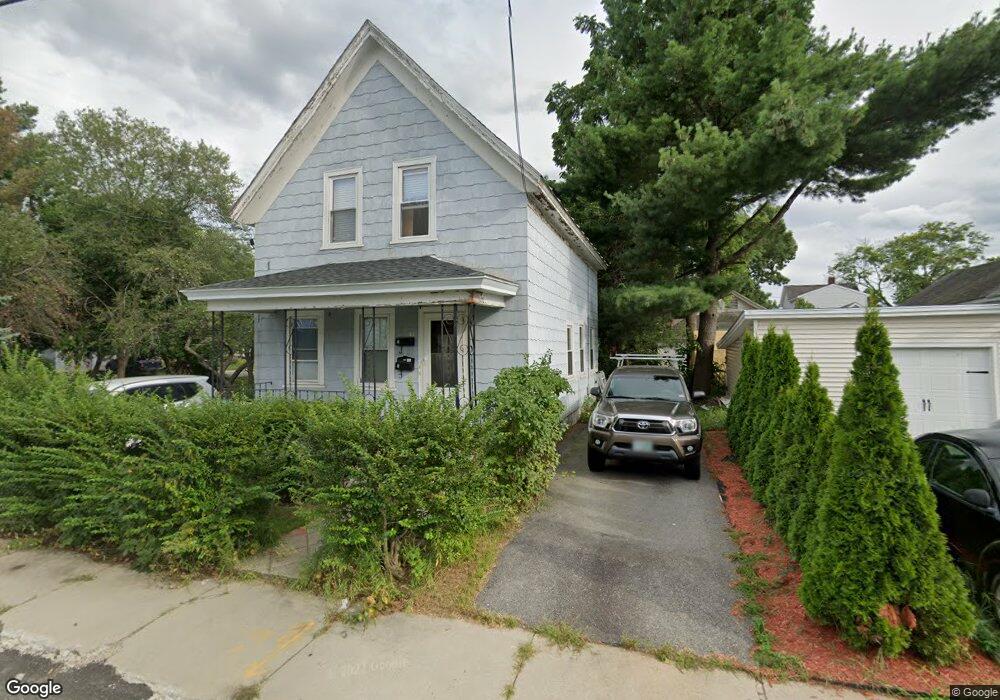
44 Gilman St Nashua, NH 03060
South End Nashua NeighborhoodEstimated Value: $485,110 - $513,000
8
Beds
2
Baths
1,387
Sq Ft
$360/Sq Ft
Est. Value
About This Home
This home is located at 44 Gilman St, Nashua, NH 03060 and is currently estimated at $499,528, approximately $360 per square foot. 44 Gilman St is a home located in Hillsborough County with nearby schools including Fairgrounds Elementary School, Fairgrounds Middle School, and Nashua High School South.
Ownership History
Date
Name
Owned For
Owner Type
Purchase Details
Closed on
Feb 2, 2021
Sold by
Morse James A and Balcom Wayne E
Bought by
Morse James A
Current Estimated Value
Home Financials for this Owner
Home Financials are based on the most recent Mortgage that was taken out on this home.
Original Mortgage
$247,500
Outstanding Balance
$220,151
Interest Rate
2.65%
Mortgage Type
New Conventional
Estimated Equity
$279,377
Purchase Details
Closed on
Dec 8, 2020
Sold by
Morse Sara K
Bought by
Morse James A
Home Financials for this Owner
Home Financials are based on the most recent Mortgage that was taken out on this home.
Original Mortgage
$247,500
Outstanding Balance
$220,151
Interest Rate
2.65%
Mortgage Type
New Conventional
Estimated Equity
$279,377
Purchase Details
Closed on
Jul 28, 2006
Sold by
Grigas Leonard M
Bought by
Morse James A and Morse Sara K
Home Financials for this Owner
Home Financials are based on the most recent Mortgage that was taken out on this home.
Original Mortgage
$205,500
Interest Rate
6.67%
Mortgage Type
Purchase Money Mortgage
Create a Home Valuation Report for This Property
The Home Valuation Report is an in-depth analysis detailing your home's value as well as a comparison with similar homes in the area
Home Values in the Area
Average Home Value in this Area
Purchase History
| Date | Buyer | Sale Price | Title Company |
|---|---|---|---|
| Morse James A | -- | None Available | |
| Morse James A | -- | None Available | |
| Morse James A | $274,000 | -- |
Source: Public Records
Mortgage History
| Date | Status | Borrower | Loan Amount |
|---|---|---|---|
| Open | Morse James A | $247,500 | |
| Previous Owner | Morse James A | $205,500 | |
| Previous Owner | Morse James A | $36,000 |
Source: Public Records
Tax History Compared to Growth
Tax History
| Year | Tax Paid | Tax Assessment Tax Assessment Total Assessment is a certain percentage of the fair market value that is determined by local assessors to be the total taxable value of land and additions on the property. | Land | Improvement |
|---|---|---|---|---|
| 2024 | $6,196 | $389,700 | $163,800 | $225,900 |
| 2023 | $5,810 | $318,700 | $131,100 | $187,600 |
| 2022 | $5,759 | $318,700 | $131,100 | $187,600 |
| 2021 | $4,934 | $212,500 | $87,300 | $125,200 |
| 2020 | $4,805 | $212,500 | $87,300 | $125,200 |
| 2019 | $4,624 | $212,500 | $87,300 | $125,200 |
| 2018 | $4,507 | $212,500 | $87,300 | $125,200 |
| 2017 | $4,851 | $188,100 | $67,600 | $120,500 |
| 2016 | $4,716 | $188,100 | $67,600 | $120,500 |
| 2015 | $4,614 | $188,100 | $67,600 | $120,500 |
| 2014 | $4,524 | $188,100 | $67,600 | $120,500 |
Source: Public Records
Map
Nearby Homes
- 22 Wilder St
- 4 Badger St
- 8 Buck St Unit 10
- 169A W Hollis St Unit 193
- 30 Ledge St
- 15 Lovell St Unit 3
- 15 Lovell St Unit 7
- 15 Lovell St Unit 10
- 38 Central St
- 97 Linwood St
- 5 Mulberry St
- 63 Dexter St
- 22 New Dunstable Rd Unit 132133
- 24 E Otterson St
- 22 Kern Dr
- 30 Gingras Dr
- 41 New Dunstable Rd Unit 371
- 1 Circle Ave
- 2 Lyons St
- 18 Harbor Ave Unit 208
- 35 Gilman St
- 3 Lovewell St Unit 107111
- 33 Gilman St
- 46 Gilman St
- 18 Ritter St
- 32 Gilman St
- 32 Gilman St Unit 2, Second Floor Unit
- 1 Lovewell St
- 39 Gilman St
- 20 Ritter St
- 30 Gilman St
- 41 Lovewell St
- 31 Gilman St Unit 311/2
- 31 Gilman St Unit 1
- 28 Gilman St
- 29 Gilman St
- 12 Ritter St
- 40 Gilman St
- 30 Lovewell St
- 37 Lovewell St