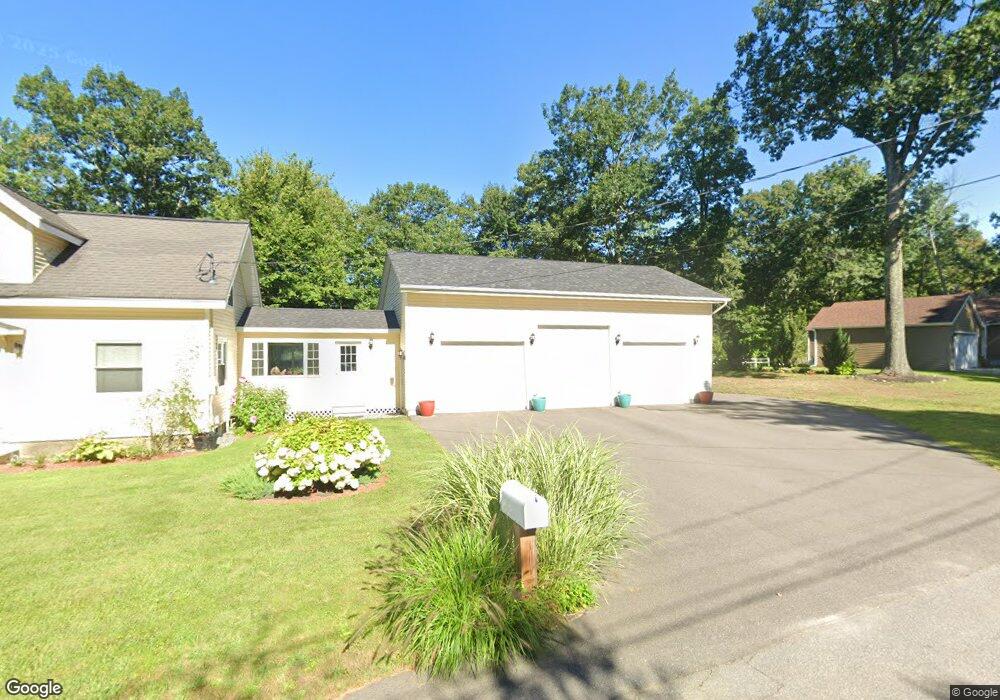
44 Heights Rd Concord, NH 03301
Concord Heights NeighborhoodEstimated Value: $396,000 - $417,000
1
Bed
1
Bath
1,094
Sq Ft
$369/Sq Ft
Est. Value
About This Home
This home is located at 44 Heights Rd, Concord, NH 03301 and is currently estimated at $403,791, approximately $369 per square foot. 44 Heights Rd is a home located in Merrimack County with nearby schools including Broken Ground School, Rundlett Middle School, and Concord High School.
Ownership History
Date
Name
Owned For
Owner Type
Purchase Details
Closed on
Oct 19, 2006
Sold by
Douglas E Knee T
Bought by
Walker Leigh J
Current Estimated Value
Home Financials for this Owner
Home Financials are based on the most recent Mortgage that was taken out on this home.
Original Mortgage
$179,910
Interest Rate
7%
Mortgage Type
Adjustable Rate Mortgage/ARM
Create a Home Valuation Report for This Property
The Home Valuation Report is an in-depth analysis detailing your home's value as well as a comparison with similar homes in the area
Home Values in the Area
Average Home Value in this Area
Purchase History
| Date | Buyer | Sale Price | Title Company |
|---|---|---|---|
| Walker Leigh J | $199,900 | -- | |
| Walker Leigh J | $199,900 | -- |
Source: Public Records
Mortgage History
| Date | Status | Borrower | Loan Amount |
|---|---|---|---|
| Open | Walker Leigh J | $180,000 | |
| Closed | Walker Leigh J | $185,000 | |
| Closed | Walker Leigh J | $179,910 |
Source: Public Records
Tax History Compared to Growth
Tax History
| Year | Tax Paid | Tax Assessment Tax Assessment Total Assessment is a certain percentage of the fair market value that is determined by local assessors to be the total taxable value of land and additions on the property. | Land | Improvement |
|---|---|---|---|---|
| 2024 | $7,327 | $264,600 | $113,700 | $150,900 |
| 2023 | $7,107 | $264,600 | $113,700 | $150,900 |
| 2022 | $6,755 | $260,900 | $113,700 | $147,200 |
| 2021 | $6,554 | $260,900 | $113,700 | $147,200 |
| 2020 | $5,860 | $219,000 | $83,600 | $135,400 |
| 2019 | $5,478 | $197,200 | $80,000 | $117,200 |
| 2018 | $5,219 | $192,700 | $80,000 | $112,700 |
| 2017 | $5,179 | $183,400 | $76,100 | $107,300 |
| 2016 | $5,019 | $181,400 | $76,100 | $105,300 |
| 2015 | $4,451 | $165,100 | $76,100 | $89,000 |
| 2014 | $3,815 | $165,100 | $76,100 | $89,000 |
| 2013 | -- | $142,800 | $76,100 | $66,700 |
| 2012 | -- | $138,500 | $76,100 | $62,400 |
Source: Public Records
Map
Nearby Homes
- 6 Heights Rd
- 6 Lawrence Street Extension
- 19 Grappone Dr
- 17 Burns Ave Unit 2
- 4 Fayette St
- 10 Perley St
- 54 Pleasant St Unit 8
- 13 Ellsworth St
- 12 E Side Dr Unit 4-13
- 14 Downing St
- 32 E Side Dr
- 26 South St
- 9 Strawberry Ln
- 7 Highridge Trail
- 30 Jackson St
- 24 Pierce St
- 17 Essex St
- 15 Bridle Path Trail
- 47 South St
- 0 Spruce St Unit 88