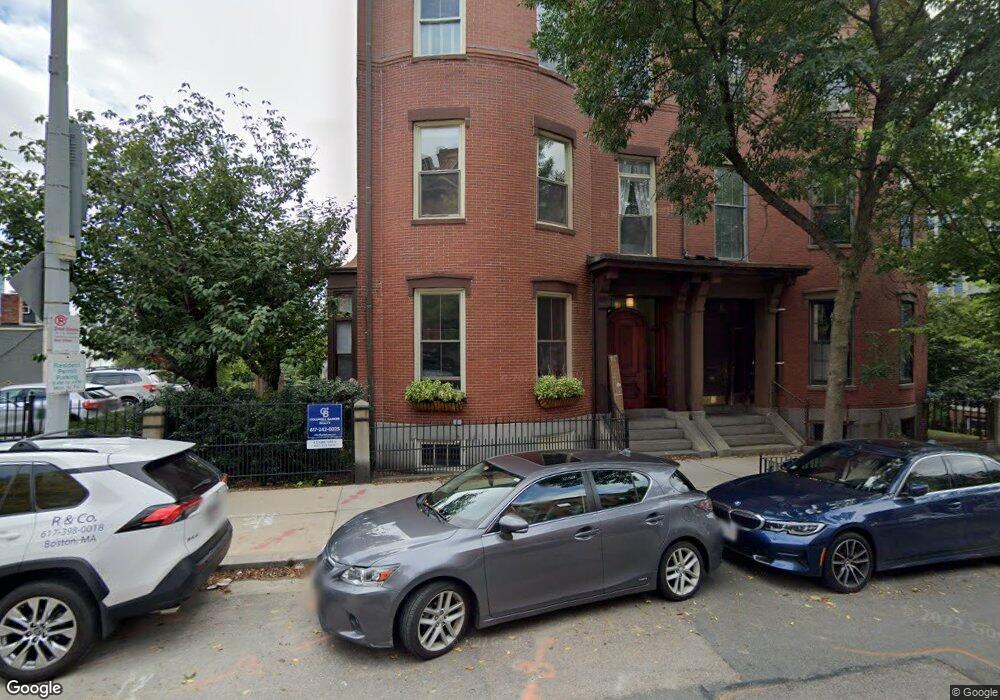
44 High St Unit 2 Charlestown, MA 02129
Thompson Square-Bunker Hill NeighborhoodEstimated Value: $1,077,396 - $1,411,000
2
Beds
2
Baths
1,182
Sq Ft
$1,014/Sq Ft
Est. Value
About This Home
This home is located at 44 High St Unit 2, Charlestown, MA 02129 and is currently estimated at $1,198,599, approximately $1,014 per square foot. 44 High St Unit 2 is a home located in Suffolk County with nearby schools including Community Charter School of Cambridge and Torit Montessori School.
Ownership History
Date
Name
Owned For
Owner Type
Purchase Details
Closed on
Sep 26, 2000
Sold by
Egan James M
Bought by
Russem Lee M and Russem Renee T
Current Estimated Value
Home Financials for this Owner
Home Financials are based on the most recent Mortgage that was taken out on this home.
Original Mortgage
$405,000
Interest Rate
8%
Mortgage Type
Purchase Money Mortgage
Purchase Details
Closed on
Nov 2, 1992
Sold by
Shannon Joseph M
Bought by
Egan James M
Home Financials for this Owner
Home Financials are based on the most recent Mortgage that was taken out on this home.
Original Mortgage
$158,000
Interest Rate
7.85%
Mortgage Type
Purchase Money Mortgage
Create a Home Valuation Report for This Property
The Home Valuation Report is an in-depth analysis detailing your home's value as well as a comparison with similar homes in the area
Home Values in the Area
Average Home Value in this Area
Purchase History
| Date | Buyer | Sale Price | Title Company |
|---|---|---|---|
| Russem Lee M | $450,000 | -- | |
| Egan James M | $198,000 | -- |
Source: Public Records
Mortgage History
| Date | Status | Borrower | Loan Amount |
|---|---|---|---|
| Open | Egan James M | $340,000 | |
| Closed | Egan James M | $340,000 | |
| Closed | Egan James M | $405,000 | |
| Previous Owner | Egan James M | $158,000 |
Source: Public Records
Tax History Compared to Growth
Tax History
| Year | Tax Paid | Tax Assessment Tax Assessment Total Assessment is a certain percentage of the fair market value that is determined by local assessors to be the total taxable value of land and additions on the property. | Land | Improvement |
|---|---|---|---|---|
| 2025 | $10,531 | $909,400 | $0 | $909,400 |
| 2024 | $9,529 | $874,200 | $0 | $874,200 |
| 2023 | $8,934 | $831,800 | $0 | $831,800 |
| 2022 | $8,701 | $799,700 | $0 | $799,700 |
| 2021 | $8,365 | $784,000 | $0 | $784,000 |
| 2020 | $8,792 | $832,600 | $0 | $832,600 |
| 2019 | $8,201 | $778,100 | $0 | $778,100 |
| 2018 | $7,767 | $741,100 | $0 | $741,100 |
| 2017 | $7,616 | $719,200 | $0 | $719,200 |
| 2016 | $7,534 | $684,900 | $0 | $684,900 |
| 2015 | $6,753 | $557,600 | $0 | $557,600 |
| 2014 | $5,920 | $470,600 | $0 | $470,600 |
Source: Public Records
Map
Nearby Homes
- 46 High St
- 56 High St Unit 3
- 172 Bunker Hill St Unit 1
- 5 Wallace Ct
- 207 Bunker Hill St Unit 2
- 9 Russell St Unit 2
- 9 Russell St Unit 1
- 1 Washington Place
- 15 Russell St
- 17 Henley St Unit F
- 17 Henley St Unit B
- 2 Washington St
- 106 Bunker Hill St Unit 6
- 106 Bunker Hill St Unit 1
- 106 Bunker Hill St Unit 4P
- 106 Bunker Hill St Unit 3
- 255 Bunker Hill St Unit 2
- 270 Bunker Hill St Unit 4
- 12 Prospect St Unit 2
- 12 Prospect St Unit 1
- 44 High St Unit 9
- 44 High St Unit 8
- 44 High St Unit 6
- 44 High St Unit 5
- 44 High St Unit 4
- 44 High St Unit 3
- 44 High St Unit 1
- 44 High St
- 50 High St Unit 52
- 50 High St Unit 52
- 50 High St Unit 52
- 50 High St Unit 1
- 16 Green St
- 46 High St Unit 3
- 46 High St Unit 2
- 43 High St Unit 3
- 43 High St Unit 2
- 43 High St Unit 1
- 45 High St Unit 2
- 45 High St Unit 1