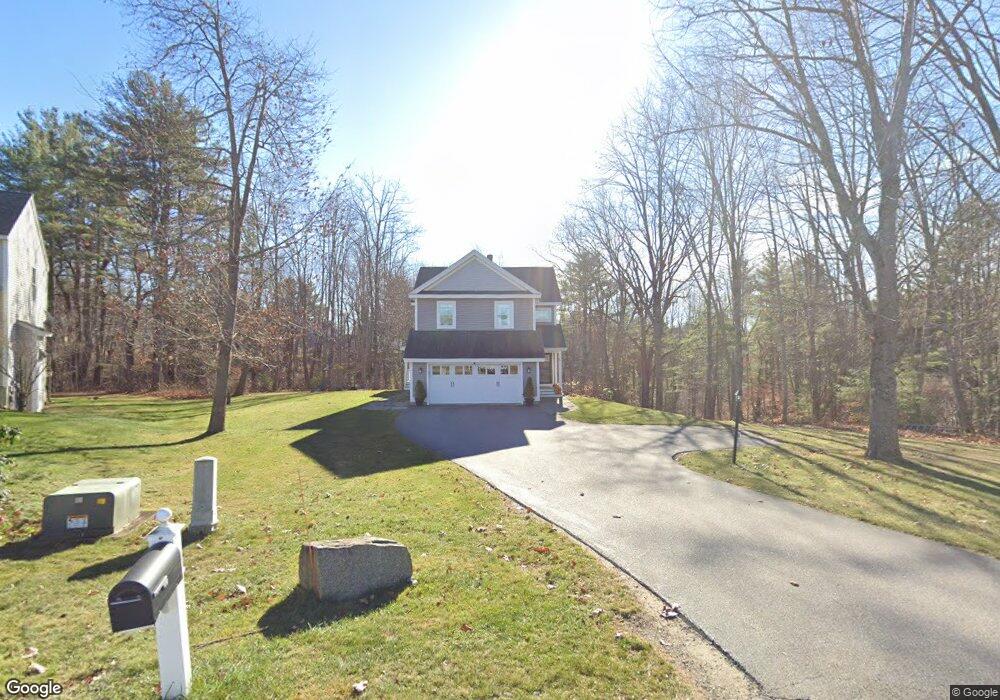
44 Hubbard St Saco, ME 04072
Central Saco NeighborhoodEstimated Value: $537,000 - $699,000
2
Beds
1
Bath
2,210
Sq Ft
$288/Sq Ft
Est. Value
About This Home
This home is located at 44 Hubbard St, Saco, ME 04072 and is currently estimated at $636,089, approximately $287 per square foot. 44 Hubbard St is a home with nearby schools including C K Burns School, Saco Middle School, and Saint James School.
Ownership History
Date
Name
Owned For
Owner Type
Purchase Details
Closed on
Jan 11, 2023
Sold by
Shrefler Colby J
Bought by
Eon Abby L
Current Estimated Value
Purchase Details
Closed on
Aug 21, 2012
Sold by
Eon Michael R
Bought by
Shrefler Colby J and Eon Abby L
Home Financials for this Owner
Home Financials are based on the most recent Mortgage that was taken out on this home.
Original Mortgage
$230,000
Interest Rate
3.67%
Mortgage Type
Purchase Money Mortgage
Purchase Details
Closed on
Jan 4, 2005
Sold by
E & R Dev Corp
Bought by
Eon Michael R
Create a Home Valuation Report for This Property
The Home Valuation Report is an in-depth analysis detailing your home's value as well as a comparison with similar homes in the area
Home Values in the Area
Average Home Value in this Area
Purchase History
| Date | Buyer | Sale Price | Title Company |
|---|---|---|---|
| Eon Abby L | -- | None Available | |
| Eon Abby L | -- | None Available | |
| Eon Abby L | -- | None Available | |
| Shrefler Colby J | -- | -- | |
| Shrefler Colby J | -- | -- | |
| Shrefler Colby J | -- | -- | |
| Eon Michael R | -- | -- | |
| Eon Michael R | -- | -- |
Source: Public Records
Mortgage History
| Date | Status | Borrower | Loan Amount |
|---|---|---|---|
| Previous Owner | Shrefler Colby J | $230,000 |
Source: Public Records
Tax History Compared to Growth
Tax History
| Year | Tax Paid | Tax Assessment Tax Assessment Total Assessment is a certain percentage of the fair market value that is determined by local assessors to be the total taxable value of land and additions on the property. | Land | Improvement |
|---|---|---|---|---|
| 2024 | $7,008 | $498,809 | $145,709 | $353,100 |
| 2023 | $7,357 | $498,809 | $145,709 | $353,100 |
| 2022 | $6,262 | $341,600 | $111,200 | $230,400 |
| 2021 | $5,985 | $317,000 | $100,500 | $216,500 |
| 2020 | $5,720 | $290,800 | $90,900 | $199,900 |
| 2019 | $5,636 | $290,800 | $90,900 | $199,900 |
| 2018 | $5,490 | $283,300 | $83,400 | $199,900 |
| 2017 | $5,543 | $286,000 | $83,400 | $202,600 |
| 2016 | $5,207 | $268,100 | $74,200 | $193,900 |
| 2015 | $5,178 | $269,400 | $74,200 | $195,200 |
| 2014 | $5,016 | $269,400 | $74,200 | $195,200 |
| 2013 | $5,005 | $269,400 | $74,200 | $195,200 |
Source: Public Records
Map
Nearby Homes