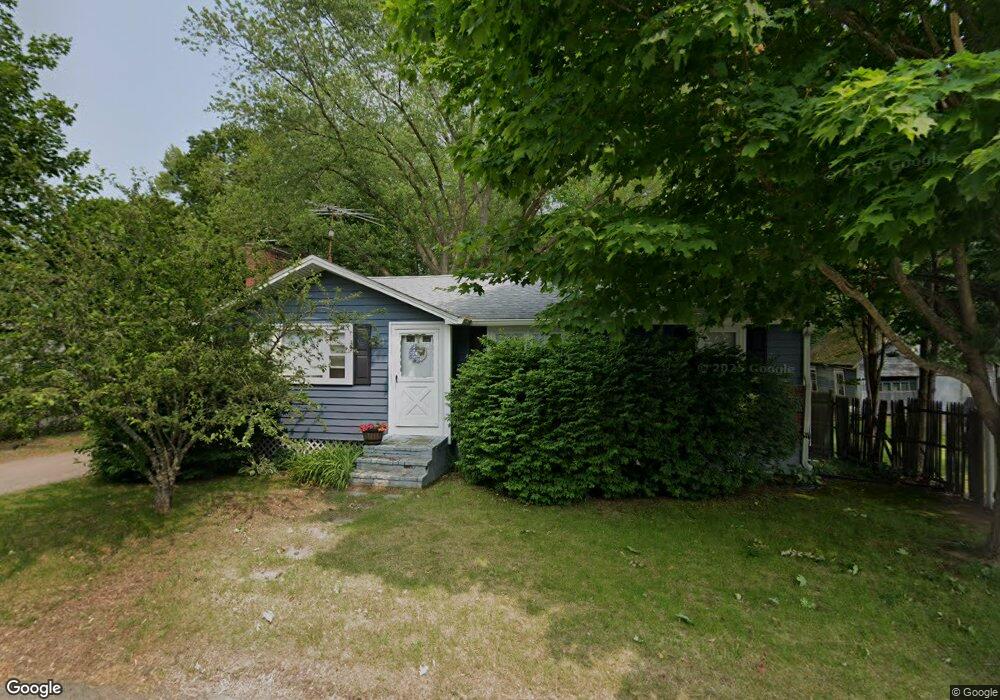
44 Jackson St Brockton, MA 02302
Campello NeighborhoodEstimated Value: $401,000 - $511,000
3
Beds
1
Bath
1,128
Sq Ft
$398/Sq Ft
Est. Value
About This Home
This home is located at 44 Jackson St, Brockton, MA 02302 and is currently estimated at $449,469, approximately $398 per square foot. 44 Jackson St is a home located in Plymouth County with nearby schools including Gilmore Elementary School, Davis K-8 School, and John F. Kennedy Elementary School.
Ownership History
Date
Name
Owned For
Owner Type
Purchase Details
Closed on
May 28, 1996
Sold by
Equicredit Corp Americ
Bought by
Tarbet Douglas L and Tarbet Diane J
Current Estimated Value
Home Financials for this Owner
Home Financials are based on the most recent Mortgage that was taken out on this home.
Original Mortgage
$56,300
Interest Rate
8.01%
Mortgage Type
Purchase Money Mortgage
Purchase Details
Closed on
Dec 7, 1995
Sold by
Foss Thomas E and Eqcc Home Eqty Loan T
Bought by
Eqcc Home Eqty Loan T and Bank Of American Il
Create a Home Valuation Report for This Property
The Home Valuation Report is an in-depth analysis detailing your home's value as well as a comparison with similar homes in the area
Home Values in the Area
Average Home Value in this Area
Purchase History
| Date | Buyer | Sale Price | Title Company |
|---|---|---|---|
| Tarbet Douglas L | $59,900 | -- | |
| Eqcc Home Eqty Loan T | $52,147 | -- |
Source: Public Records
Mortgage History
| Date | Status | Borrower | Loan Amount |
|---|---|---|---|
| Open | Eqcc Home Eqty Loan T | $92,000 | |
| Closed | Eqcc Home Eqty Loan T | $60,000 | |
| Closed | Eqcc Home Eqty Loan T | $56,300 | |
| Previous Owner | Eqcc Home Eqty Loan T | $43,000 |
Source: Public Records
Tax History
| Year | Tax Paid | Tax Assessment Tax Assessment Total Assessment is a certain percentage of the fair market value that is determined by local assessors to be the total taxable value of land and additions on the property. | Land | Improvement |
|---|---|---|---|---|
| 2025 | $4,644 | $383,500 | $140,200 | $243,300 |
| 2024 | $4,547 | $378,300 | $140,200 | $238,100 |
| 2023 | $4,337 | $334,100 | $104,900 | $229,200 |
| 2022 | $4,128 | $295,500 | $95,400 | $200,100 |
| 2021 | $3,857 | $266,000 | $79,400 | $186,600 |
| 2020 | $3,921 | $258,800 | $74,200 | $184,600 |
| 2019 | $3,803 | $244,700 | $72,400 | $172,300 |
| 2018 | $3,469 | $216,000 | $72,400 | $143,600 |
| 2017 | $3,199 | $198,700 | $72,400 | $126,300 |
| 2016 | $3,186 | $183,500 | $70,200 | $113,300 |
| 2015 | $2,735 | $150,700 | $70,200 | $80,500 |
| 2014 | $2,749 | $151,600 | $70,200 | $81,400 |
Source: Public Records
Map
Nearby Homes
- 111 Riverview St
- 41 Riverview St
- 100 Concord St
- 112 Hillside Ave
- 44 Baker St
- 223 Clinton St Unit 16
- 28 Wallace St
- 15 Otto St
- 23 E Chestnut St
- 103 Clinton St
- 12 Paulin Ave
- 25 Tremont St
- 202 Summer St
- 32 Foothill Rd
- 65 Tremont St
- 936 Warren Ave
- 115 Market St
- 34 Oakland St
- 34 Hillberg Ave
- 118 Deanna Rd
- 40 Jackson St
- 54 Jackson St
- 208 Perkins Ave
- 34 Jackson St
- 198 Perkins Ave
- 214 Perkins Ave
- 45 Jackson St
- 43 Jackson St
- 194 Perkins Ave
- 28 Jackson St
- 218 Perkins Ave
- 188 Perkins Ave
- 188 Perkins Ave Unit 188 Perkins Ave
- 188 Perkins Ave Unit 3
- 181 Concord St
- 21 Sansom St Unit 1
- 19 Sansom St Unit 2
- 222 Perkins Ave
- 24 Jackson St
- 27 Jackson St
Your Personal Tour Guide
Ask me questions while you tour the home.