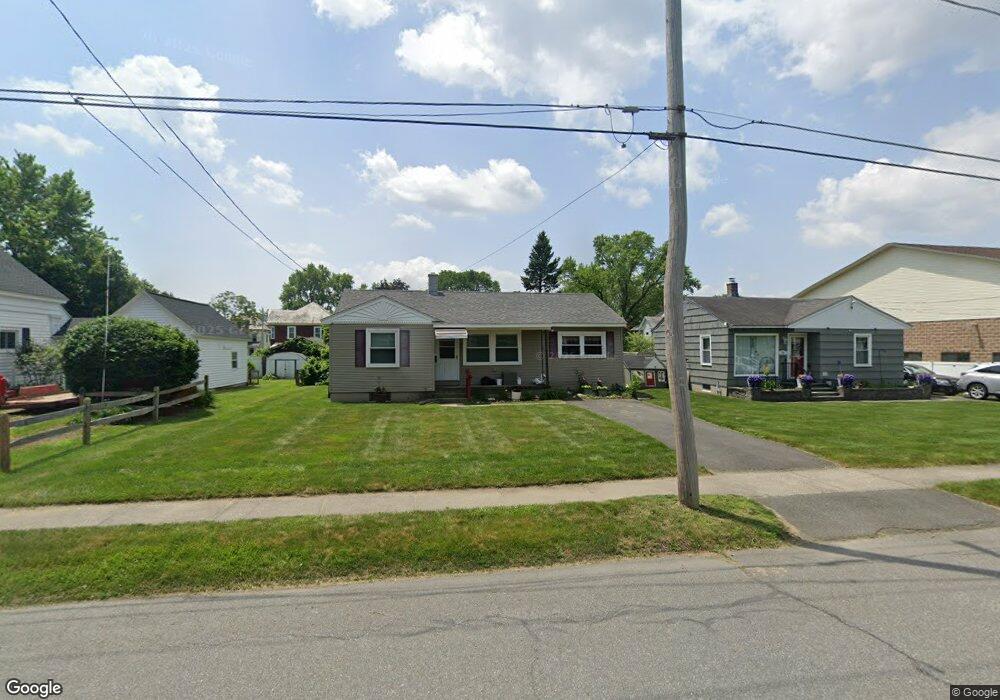
44 Kenwood St Greenfield, MA 01301
Estimated Value: $288,000 - $336,000
3
Beds
1
Bath
1,102
Sq Ft
$288/Sq Ft
Est. Value
About This Home
This home is located at 44 Kenwood St, Greenfield, MA 01301 and is currently estimated at $317,002, approximately $287 per square foot. 44 Kenwood St is a home located in Franklin County with nearby schools including Cornerstone Christian School and Holy Trinity School.
Ownership History
Date
Name
Owned For
Owner Type
Purchase Details
Closed on
Jul 11, 2008
Sold by
Miller Wendy M
Bought by
Ozdarski Karen M
Current Estimated Value
Home Financials for this Owner
Home Financials are based on the most recent Mortgage that was taken out on this home.
Original Mortgage
$147,600
Interest Rate
6.13%
Mortgage Type
Purchase Money Mortgage
Purchase Details
Closed on
Sep 30, 2002
Sold by
Ridgemont Properties
Bought by
Miller Wendy M
Purchase Details
Closed on
Jul 30, 2002
Sold by
Usa Rhs
Bought by
Ridgemont Prop
Purchase Details
Closed on
Jan 30, 1998
Sold by
Conant Michelle A and Stetson Michelle A
Bought by
Whitney Robert E and Whitney Tina M
Purchase Details
Closed on
Dec 18, 1987
Sold by
Ackermann Frederick
Bought by
Stetson Michelle A
Create a Home Valuation Report for This Property
The Home Valuation Report is an in-depth analysis detailing your home's value as well as a comparison with similar homes in the area
Home Values in the Area
Average Home Value in this Area
Purchase History
| Date | Buyer | Sale Price | Title Company |
|---|---|---|---|
| Ozdarski Karen M | $164,000 | -- | |
| Ozdarski Karen M | $164,000 | -- | |
| Miller Wendy M | $115,000 | -- | |
| Miller Wendy M | $115,000 | -- | |
| Ridgemont Prop | $89,000 | -- | |
| Ridgemont Prop | $89,000 | -- | |
| Whitney Robert E | $93,000 | -- | |
| Whitney Robert E | $93,000 | -- | |
| Stetson Michelle A | $95,000 | -- |
Source: Public Records
Mortgage History
| Date | Status | Borrower | Loan Amount |
|---|---|---|---|
| Open | Stetson Michelle A | $149,400 | |
| Closed | Ozdarski Karen M | $147,600 |
Source: Public Records
Tax History Compared to Growth
Tax History
| Year | Tax Paid | Tax Assessment Tax Assessment Total Assessment is a certain percentage of the fair market value that is determined by local assessors to be the total taxable value of land and additions on the property. | Land | Improvement |
|---|---|---|---|---|
| 2025 | $5,242 | $268,000 | $65,400 | $202,600 |
| 2024 | $5,171 | $253,600 | $52,400 | $201,200 |
| 2023 | $4,663 | $237,300 | $52,400 | $184,900 |
| 2022 | $4,306 | $192,900 | $47,500 | $145,400 |
| 2021 | $4,156 | $179,000 | $47,100 | $131,900 |
| 2020 | $3,715 | $162,000 | $42,900 | $119,100 |
| 2019 | $3,497 | $156,400 | $37,300 | $119,100 |
| 2018 | $3,434 | $153,100 | $36,600 | $116,500 |
| 2017 | $3,327 | $153,100 | $36,600 | $116,500 |
| 2016 | $3,195 | $146,500 | $35,200 | $111,300 |
| 2015 | $3,302 | $146,700 | $39,400 | $107,300 |
| 2014 | $3,012 | $146,700 | $39,400 | $107,300 |
Source: Public Records
Map
Nearby Homes