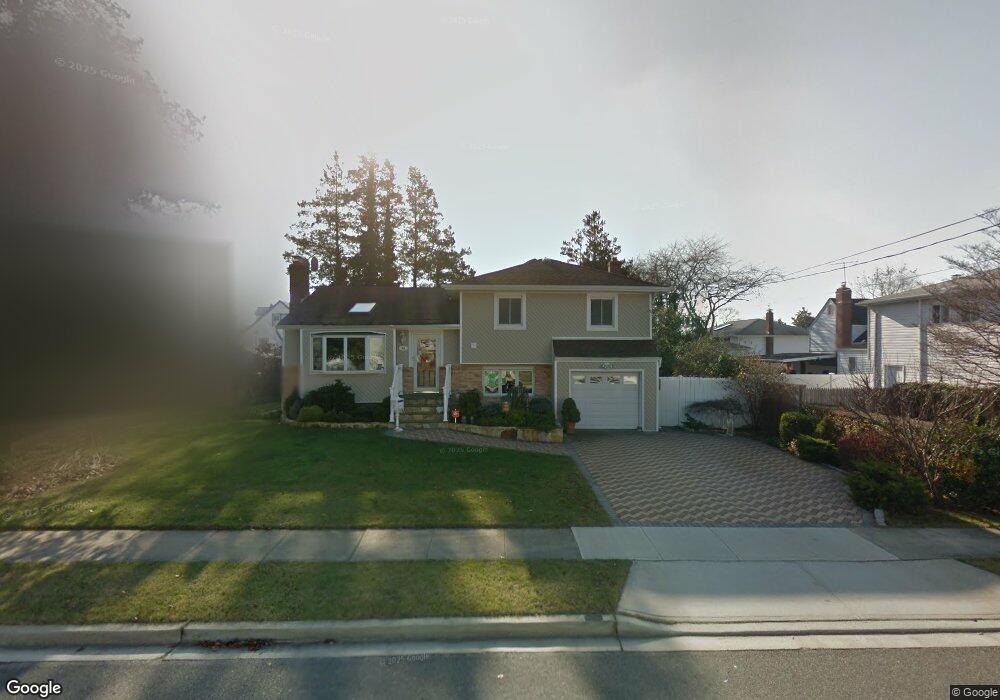
44 Maple St Massapequa, NY 11758
Estimated Value: $811,000 - $846,686
3
Beds
2
Baths
1,836
Sq Ft
$451/Sq Ft
Est. Value
About This Home
This home is located at 44 Maple St, Massapequa, NY 11758 and is currently estimated at $828,843, approximately $451 per square foot. 44 Maple St is a home located in Nassau County with nearby schools including Massapequa High School - Ames Campus, Berner Middle School, and Massapequa High School.
Ownership History
Date
Name
Owned For
Owner Type
Purchase Details
Closed on
Aug 18, 2015
Sold by
Orbach Bernard Y and Orbach Bronia
Bought by
Bruno Chris Anthony and Bruno Antoinette
Current Estimated Value
Home Financials for this Owner
Home Financials are based on the most recent Mortgage that was taken out on this home.
Original Mortgage
$396,000
Outstanding Balance
$311,875
Interest Rate
4.07%
Mortgage Type
New Conventional
Estimated Equity
$516,968
Purchase Details
Closed on
Jan 30, 1997
Sold by
Mercier Russell
Bought by
Mirman Andrew and Mirman Jennifer
Create a Home Valuation Report for This Property
The Home Valuation Report is an in-depth analysis detailing your home's value as well as a comparison with similar homes in the area
Home Values in the Area
Average Home Value in this Area
Purchase History
| Date | Buyer | Sale Price | Title Company |
|---|---|---|---|
| Bruno Chris Anthony | $495,000 | Attorney | |
| Mirman Andrew | $213,750 | -- |
Source: Public Records
Mortgage History
| Date | Status | Borrower | Loan Amount |
|---|---|---|---|
| Open | Bruno Chris Anthony | $396,000 |
Source: Public Records
Tax History
| Year | Tax Paid | Tax Assessment Tax Assessment Total Assessment is a certain percentage of the fair market value that is determined by local assessors to be the total taxable value of land and additions on the property. | Land | Improvement |
|---|---|---|---|---|
| 2025 | $16,041 | $563 | $192 | $371 |
| 2024 | $4,484 | $532 | $180 | $352 |
Source: Public Records
Map
Nearby Homes
- 60 Cherry St
- 54 Chestnut St
- 21 Chestnut St
- 69 Hawthorne St
- 2125 North Dr
- 187 Massapequa Ave
- 2097 Washington Ave
- 4460 Merrick Rd
- 1967 Washington Ave
- 119 Alhambra Rd
- 32 Saint Marks Place
- 135 Ocean Ave
- 4530 Merrick Rd
- 5 Canal Rd
- 76 Alhambra Rd
- 63 Pennsylvania Ave
- 2349 S Seamans Neck Rd
- 36 Michigan Ave
- 2162 Seamans Neck Rd
- 3861 Wilburne Ave
Your Personal Tour Guide
Ask me questions while you tour the home.