
Seller's Agent in 2025
Jane O'Connor
Coldwell Banker Realty - Worcester
(508) 635-6645
8 in this area
101 Total Sales
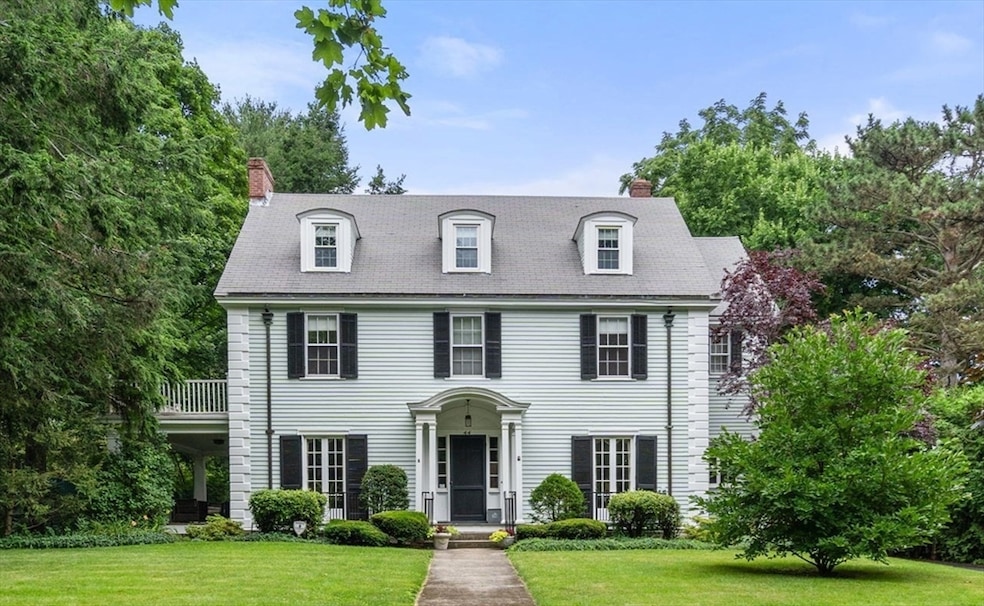


This spacious 1918 Colonial home is a perfect blend of historic charm and modern amenities. With five-bedrooms and four full and 2 half baths, this home offers plenty of space for families of all sizes. There are hardwood floors throughout the home, high ceilings, exquisite crown moldings, picture frame moldings and arched doorways are just a few of the architectural details that make this home truly special. There is a step-down fireplaced family room which is perfect for cozy nights, while the separate formal living room provides an additional fireplace and is a great space for entertaining guests. The recently updated kitchen is both functional and stylish, with quartz countertops and stainless steel appliances, perfect for a formal dinner party or enjoying a casual breakfast . Each bedroom provides a sense of privacy and space with both private and shared baths. There are 2 rooms that provide in home office or exercise rooms. Part of the Greater Hammond Heights neighborhood.
Last Agent to Sell the Property
Coldwell Banker Realty - Worcester Listed on: 09/08/2025
| Date | Type | Sale Price | Title Company |
|---|---|---|---|
| Quit Claim Deed | $868,000 | -- | |
| Deed | $280,000 | -- |
| Date | Status | Loan Amount | Loan Type |
|---|---|---|---|
| Open | $694,400 | Purchase Money Mortgage | |
| Previous Owner | $368,800 | No Value Available | |
| Previous Owner | $212,000 | No Value Available | |
| Previous Owner | $220,000 | No Value Available |
| Date | Event | Price | List to Sale | Price per Sq Ft |
|---|---|---|---|---|
| 10/31/2025 10/31/25 | Sold | $868,000 | -3.4% | $200 / Sq Ft |
| 09/18/2025 09/18/25 | Pending | -- | -- | -- |
| 09/08/2025 09/08/25 | For Sale | $899,000 | -- | $207 / Sq Ft |
| Year | Tax Paid | Tax Assessment Tax Assessment Total Assessment is a certain percentage of the fair market value that is determined by local assessors to be the total taxable value of land and additions on the property. | Land | Improvement |
|---|---|---|---|---|
| 2025 | $10,466 | $793,500 | $124,100 | $669,400 |
| 2024 | $10,064 | $731,900 | $124,100 | $607,800 |
| 2023 | $9,770 | $681,300 | $106,900 | $574,400 |
| 2022 | $9,173 | $603,100 | $85,500 | $517,600 |
| 2021 | $4,808 | $562,100 | $68,400 | $493,700 |
| 2020 | $9,100 | $535,300 | $68,100 | $467,200 |
| 2019 | $9,274 | $515,200 | $66,000 | $449,200 |
| 2018 | $9,168 | $484,800 | $66,000 | $418,800 |
| 2017 | $9,166 | $476,900 | $66,000 | $410,900 |
| 2016 | $9,594 | $465,500 | $55,500 | $410,000 |
| 2015 | $9,343 | $465,500 | $55,500 | $410,000 |
| 2014 | $9,096 | $465,500 | $55,500 | $410,000 |
Seller's Agent in 2025
Jane O'Connor
Coldwell Banker Realty - Worcester
(508) 635-6645
8 in this area
101 Total Sales
C
Seller Co-Listing Agent in 2025
Christine Ciociolo
Coldwell Banker Realty - Worcester
1 in this area
11 Total Sales
Buyer's Agent in 2025
Erin Zamarro
Coldwell Banker Realty - Worcester
(508) 847-7100
3 in this area
76 Total Sales
Source: MLS Property Information Network (MLS PIN)
MLS Number: 73427664
APN: WORC-000020-000011-000010
Disclaimer: Certain information contained herein is derived from information provided by parties other than Homes.com. All information provided is deemed reliable, but is not guaranteed to be accurate and should be independently verified.
![]() The property listing data and information, or the Images, set forth herein were provided to MLS Property Information Network, Inc. from third party sources, including sellers, lessors and public records, and were compiled by MLS Property Information Network, Inc. The property listing data and information, and the Images, are for the personal, non-commercial use of consumers having a good faith interest in purchasing or leasing listed properties of the type displayed to them and may not be used for any purpose other than to identify prospective properties which such consumers may have a good faith interest in purchasing or leasing. MLS Property Information Network, Inc. and its subscribers disclaim any and all representations and warranties as to the accuracy of the property listing data and information, or as to the accuracy of any of the Images, set forth herein.
The property listing data and information, or the Images, set forth herein were provided to MLS Property Information Network, Inc. from third party sources, including sellers, lessors and public records, and were compiled by MLS Property Information Network, Inc. The property listing data and information, and the Images, are for the personal, non-commercial use of consumers having a good faith interest in purchasing or leasing listed properties of the type displayed to them and may not be used for any purpose other than to identify prospective properties which such consumers may have a good faith interest in purchasing or leasing. MLS Property Information Network, Inc. and its subscribers disclaim any and all representations and warranties as to the accuracy of the property listing data and information, or as to the accuracy of any of the Images, set forth herein.
Ask me questions while you tour the home.