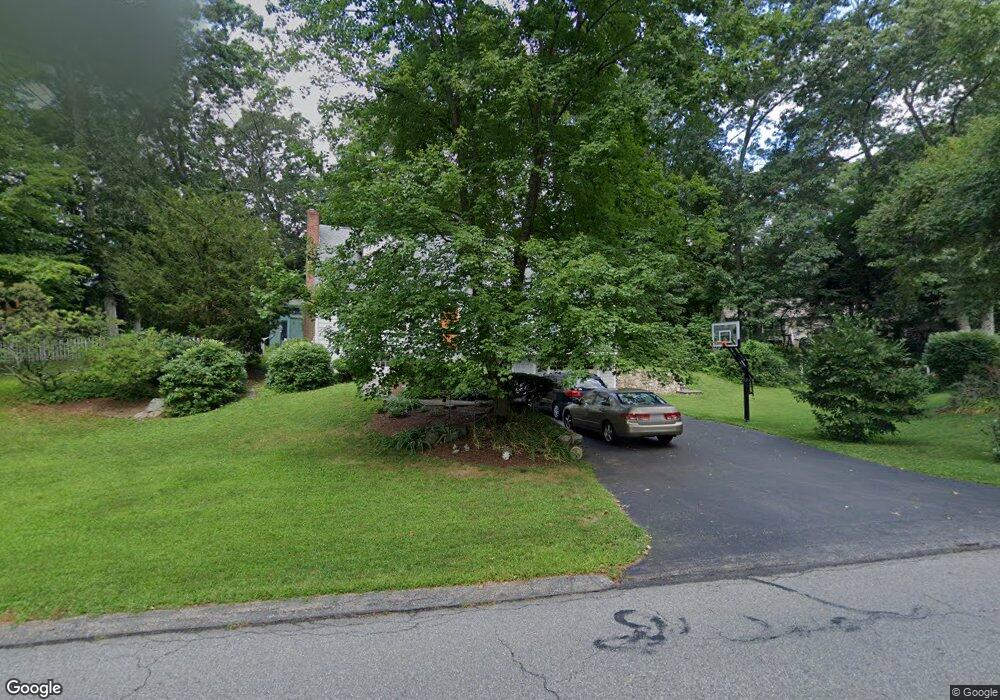
44 Millbrook Rd Wayland, MA 01778
Estimated Value: $854,000 - $1,152,000
2
Beds
2
Baths
1,883
Sq Ft
$534/Sq Ft
Est. Value
About This Home
This home is located at 44 Millbrook Rd, Wayland, MA 01778 and is currently estimated at $1,004,755, approximately $533 per square foot. 44 Millbrook Rd is a home located in Middlesex County with nearby schools including Wayland High School and Veritas Christian Academy.
Ownership History
Date
Name
Owned For
Owner Type
Purchase Details
Closed on
May 28, 1999
Sold by
Danforth Stuart G and Danforth Julie A
Bought by
Dowling William M and Dowling Jennifer C
Current Estimated Value
Home Financials for this Owner
Home Financials are based on the most recent Mortgage that was taken out on this home.
Original Mortgage
$240,000
Interest Rate
6.82%
Mortgage Type
Purchase Money Mortgage
Purchase Details
Closed on
Sep 22, 1995
Sold by
Yeager Rt and Yeager
Bought by
Danforth Stuart G and Danforth Julie A
Create a Home Valuation Report for This Property
The Home Valuation Report is an in-depth analysis detailing your home's value as well as a comparison with similar homes in the area
Home Values in the Area
Average Home Value in this Area
Purchase History
| Date | Buyer | Sale Price | Title Company |
|---|---|---|---|
| Dowling William M | $327,500 | -- | |
| Danforth Stuart G | $237,500 | -- |
Source: Public Records
Mortgage History
| Date | Status | Borrower | Loan Amount |
|---|---|---|---|
| Open | Danforth Stuart G | $250,000 | |
| Closed | Danforth Stuart G | $270,000 | |
| Closed | Danforth Stuart G | $240,000 |
Source: Public Records
Tax History
| Year | Tax Paid | Tax Assessment Tax Assessment Total Assessment is a certain percentage of the fair market value that is determined by local assessors to be the total taxable value of land and additions on the property. | Land | Improvement |
|---|---|---|---|---|
| 2025 | $14,927 | $955,000 | $490,300 | $464,700 |
| 2024 | $14,111 | $909,200 | $466,900 | $442,300 |
| 2023 | $13,688 | $822,100 | $424,500 | $397,600 |
| 2022 | $13,008 | $708,900 | $351,600 | $357,300 |
| 2021 | $0 | $676,800 | $319,500 | $357,300 |
| 2020 | $12,020 | $676,800 | $319,500 | $357,300 |
| 2019 | $11,328 | $619,700 | $304,400 | $315,300 |
| 2018 | $0 | $589,300 | $304,400 | $284,900 |
| 2017 | $3,718 | $574,000 | $289,800 | $284,200 |
| 2016 | $9,436 | $544,200 | $284,100 | $260,100 |
| 2015 | $9,327 | $507,200 | $284,100 | $223,100 |
Source: Public Records
Map
Nearby Homes
- 1 Winthrop Terrace
- 2 Old Sudbury Rd
- 20 Lee Rd
- 156 Boston Post Rd
- 63 Claypit Hill Rd
- 13 Rich Valley Rd
- 37 Orchard Ln
- 17 Glezen Ln
- 6 Dairy Farm Ln
- 26 Jeffrey Rd
- 127 Glezen Ln
- 93 Draper Rd
- 823 Boston Post Rd
- 23 Covered Bridge Ln
- 32 Highland Cir
- 21 Westerly Rd
- 218 Old Connecticut Path
- 1203 Magnolia Dr Unit 1203
- 9 Sanderson Ln
- 1 Cole Rd
Your Personal Tour Guide
Ask me questions while you tour the home.