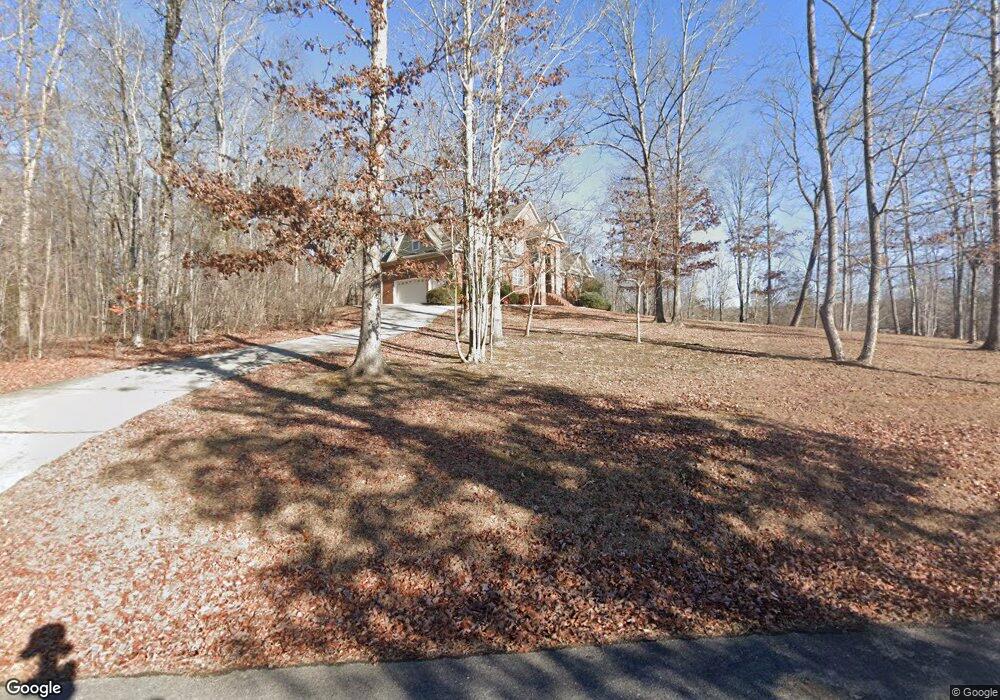
44 Mountain Laurel Ln Signal Mountain, TN 37377
Estimated Value: $666,577 - $758,000
3
Beds
3
Baths
3,232
Sq Ft
$216/Sq Ft
Est. Value
About This Home
This home is located at 44 Mountain Laurel Ln, Signal Mountain, TN 37377 and is currently estimated at $697,144, approximately $215 per square foot. 44 Mountain Laurel Ln is a home located in Sequatchie County with nearby schools including Griffith Elementary School, Sequatchie County Middle School, and Sequatchie County High School.
Ownership History
Date
Name
Owned For
Owner Type
Purchase Details
Closed on
Mar 17, 2005
Sold by
Vanderhoof David Dba
Bought by
Griswold Michael E
Current Estimated Value
Home Financials for this Owner
Home Financials are based on the most recent Mortgage that was taken out on this home.
Original Mortgage
$266,400
Outstanding Balance
$134,700
Interest Rate
5.57%
Estimated Equity
$562,444
Purchase Details
Closed on
Mar 31, 2004
Sold by
Par Berry and Par Yarbrough
Bought by
Vanderhoof David Dba
Purchase Details
Closed on
Mar 3, 2000
Bought by
Berry Hunt & Yarbrough Partnership
Purchase Details
Closed on
Jul 29, 1993
Bought by
Nunley Randy L
Create a Home Valuation Report for This Property
The Home Valuation Report is an in-depth analysis detailing your home's value as well as a comparison with similar homes in the area
Home Values in the Area
Average Home Value in this Area
Purchase History
| Date | Buyer | Sale Price | Title Company |
|---|---|---|---|
| Griswold Michael E | $333,000 | -- | |
| Vanderhoof David Dba | $30,510 | -- | |
| Berry Hunt & Yarbrough Partnership | $116,000 | -- | |
| Nunley Randy L | $170,400 | -- |
Source: Public Records
Mortgage History
| Date | Status | Borrower | Loan Amount |
|---|---|---|---|
| Open | Nunley Randy L | $266,400 | |
| Closed | Nunley Randy L | $33,300 |
Source: Public Records
Tax History Compared to Growth
Tax History
| Year | Tax Paid | Tax Assessment Tax Assessment Total Assessment is a certain percentage of the fair market value that is determined by local assessors to be the total taxable value of land and additions on the property. | Land | Improvement |
|---|---|---|---|---|
| 2024 | $2,493 | $135,750 | $12,025 | $123,725 |
| 2023 | $2,493 | $135,750 | $12,025 | $123,725 |
| 2022 | $1,981 | $81,125 | $10,150 | $70,975 |
| 2021 | $1,981 | $81,125 | $10,150 | $70,975 |
| 2020 | $1,981 | $81,125 | $10,150 | $70,975 |
| 2019 | $1,981 | $81,125 | $10,150 | $70,975 |
| 2018 | $1,981 | $81,125 | $10,150 | $70,975 |
| 2017 | $1,987 | $81,350 | $10,150 | $71,200 |
| 2016 | $1,964 | $76,450 | $9,125 | $67,325 |
| 2015 | $1,952 | $76,000 | $9,000 | $67,000 |
| 2014 | $1,952 | $76,000 | $9,000 | $67,000 |
Source: Public Records
Map
Nearby Homes
- 71 Miller Cove Cir
- 43 Miller Cove Cir
- 460 Spring Dr
- 0 Clear Brooks Dr Unit RTC2912326
- 0 Clear Brooks Dr Unit 1506809
- 2803 Us 127
- 763 U S 127
- 0 Dandy Rd Unit 1512628
- 342 Miller Rd
- 28 Lynn Rd
- 78 Gray Rd
- 280 Pine Ridge Dr
- 3014 Edgewood Dr
- 435 County Line Rd
- 720 Miller Rd
- 361 Pine Ridge Dr
- 316 Brock Creek Trail
- 2610 Eagle Creek Way
- 2435 Blue Mist Dr
- 6475 Polly Ln
- 5 Mountain Laurel Ln
- 7 Mountain Laurel Ln
- 6 Mountain Laurel Ln
- 406 Rock Creek Trail
- 409 Rock Creek Trail
- 3 Rock Creek Trail
- 16 Rock Creek Trail
- 1725 Rock Creek Trail
- 9 Rock Creek Trail
- 20 Rock Creek Trail
- 6 Rock Creek Trail
- 5 Rock Creek Trail
- 8 Rock Creek Trail
- 7 Rock Creek Trail
- 10 Rock Creek Trail
- 21 Rock Creek Trail
- 22 Rock Creek Trail
- 4 Rock Creek Trail
- 18 Rock Creek Trail
- 12 Rock Creek Trail