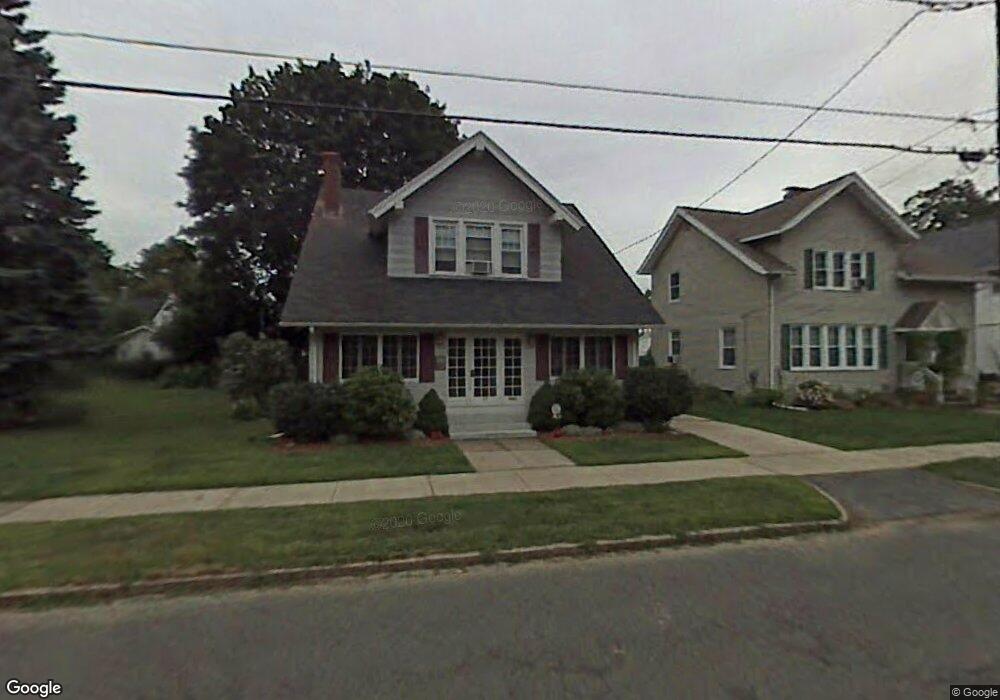
44 Nelson St West Springfield, MA 01089
Estimated Value: $347,000 - $415,000
3
Beds
1
Bath
1,640
Sq Ft
$223/Sq Ft
Est. Value
About This Home
This home is located at 44 Nelson St, West Springfield, MA 01089 and is currently estimated at $366,295, approximately $223 per square foot. 44 Nelson St is a home located in Hampden County with nearby schools including St Thomas The Apostle School.
Ownership History
Date
Name
Owned For
Owner Type
Purchase Details
Closed on
Apr 23, 2024
Sold by
Richter Cecelia M
Bought by
Richter Kevin A
Current Estimated Value
Purchase Details
Closed on
May 16, 2011
Sold by
Flowers James J and Flowers Kathy A
Bought by
Richter Cecelia M
Home Financials for this Owner
Home Financials are based on the most recent Mortgage that was taken out on this home.
Original Mortgage
$181,284
Interest Rate
4.75%
Mortgage Type
FHA
Purchase Details
Closed on
Oct 28, 1994
Sold by
Kaminski Walter F and Kaminski Caroline
Bought by
Flowers James J and Flowers Kathy A
Create a Home Valuation Report for This Property
The Home Valuation Report is an in-depth analysis detailing your home's value as well as a comparison with similar homes in the area
Home Values in the Area
Average Home Value in this Area
Purchase History
| Date | Buyer | Sale Price | Title Company |
|---|---|---|---|
| Richter Kevin A | -- | None Available | |
| Richter Kevin A | -- | None Available | |
| Richter Cecelia M | $186,000 | -- | |
| Richter Cecelia M | $186,000 | -- | |
| Flowers James J | $106,900 | -- | |
| Flowers James J | $106,900 | -- |
Source: Public Records
Mortgage History
| Date | Status | Borrower | Loan Amount |
|---|---|---|---|
| Previous Owner | Richter Cecelia M | $181,284 | |
| Previous Owner | Flowers James J | $31,630 | |
| Previous Owner | Flowers James J | $95,500 |
Source: Public Records
Tax History Compared to Growth
Tax History
| Year | Tax Paid | Tax Assessment Tax Assessment Total Assessment is a certain percentage of the fair market value that is determined by local assessors to be the total taxable value of land and additions on the property. | Land | Improvement |
|---|---|---|---|---|
| 2025 | $4,381 | $294,600 | $108,200 | $186,400 |
| 2024 | $4,012 | $270,900 | $108,200 | $162,700 |
| 2023 | $3,821 | $245,900 | $108,200 | $137,700 |
| 2022 | $3,368 | $213,700 | $98,200 | $115,500 |
| 2021 | $3,282 | $194,200 | $91,000 | $103,200 |
| 2020 | $3,172 | $186,700 | $91,000 | $95,700 |
| 2019 | $3,166 | $186,700 | $91,000 | $95,700 |
| 2018 | $3,183 | $186,700 | $91,000 | $95,700 |
| 2017 | $3,183 | $186,700 | $91,000 | $95,700 |
| 2016 | $3,113 | $183,200 | $87,500 | $95,700 |
| 2015 | $3,055 | $179,800 | $85,800 | $94,000 |
| 2014 | $741 | $179,800 | $85,800 | $94,000 |
Source: Public Records
Map
Nearby Homes