B
Seller's Agent in 2018
Bryan Schild
The Agency Team
Estimated Value: $884,000 - $1,446,000
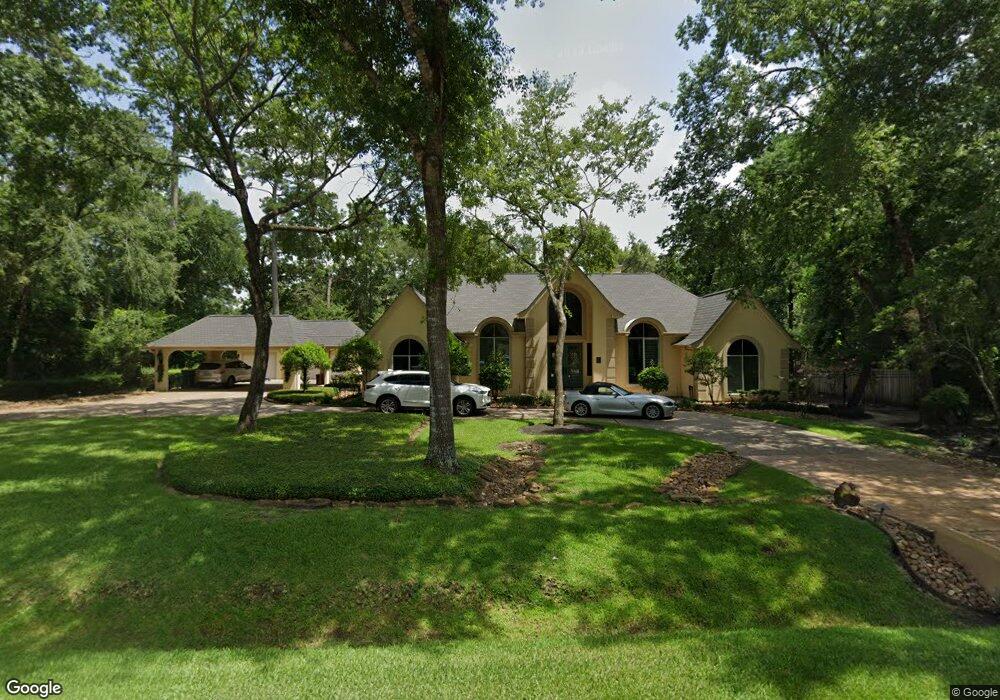
rare woodlands find, 1st flood only got inches of water, Stuuco 1 story amazing pool, almost 1 acre lot
Last Agent to Sell the Property
Bryan Schild
The Agency Team License #0561080 Listed on: 12/02/2017

| Date | Buyer | Sale Price | Title Company |
|---|---|---|---|
| Houstons Biggest Home Buyers | -- | Stewart Title | |
| Franks Stephen R | -- | -- | |
| Franks Stephen R | -- | -- | |
| Franks Stephen R | -- | -- |
| Date | Status | Borrower | Loan Amount |
|---|---|---|---|
| Closed | Houstons Biggest Home Buyers | $432,000 | |
| Previous Owner | Franks Stephen R | $280,000 |
| Date | Event | Price | List to Sale | Price per Sq Ft |
|---|---|---|---|---|
| 12/30/2021 12/30/21 | Off Market | -- | -- | -- |
| 01/26/2018 01/26/18 | Sold | -- | -- | -- |
| 12/27/2017 12/27/17 | Pending | -- | -- | -- |
| 12/02/2017 12/02/17 | For Sale | $449,998 | -- | $118 / Sq Ft |
| Year | Tax Paid | Tax Assessment Tax Assessment Total Assessment is a certain percentage of the fair market value that is determined by local assessors to be the total taxable value of land and additions on the property. | Land | Improvement |
|---|---|---|---|---|
| 2025 | -- | $677,878 | -- | -- |
| 2024 | $8,633 | $616,253 | -- | -- |
| 2023 | $8,633 | $560,230 | $120,000 | $555,000 |
| 2022 | $10,292 | $509,300 | $120,000 | $516,750 |
| 2021 | $10,101 | $463,000 | $44,450 | $418,550 |
| 2020 | $11,025 | $484,000 | $44,450 | $450,550 |
| 2019 | $10,358 | $440,000 | $44,450 | $395,550 |
| 2018 | $6,910 | $293,510 | $44,450 | $249,060 |
| 2017 | $15,116 | $634,180 | $44,450 | $767,890 |
| 2016 | $13,742 | $576,530 | $44,450 | $767,890 |
| 2015 | $10,133 | $524,120 | $44,450 | $887,540 |
| 2014 | $10,133 | $476,470 | $44,450 | $432,020 |
B
Seller's Agent in 2018
Bryan Schild
The Agency Team
Buyer's Agent in 2018
Chris Wren
Treaty Oak Developers, LLC
(281) 705-6416
3 in this area
27 Total Sales
R
Buyer Co-Listing Agent in 2018
Rick Gaul
America's Land Partners - Houston Texas, LLC
(281) 475-5111
17 Total Sales
Source: Houston Association of REALTORS®
MLS Number: 23064467
APN: 9728-59-03100
Disclaimer: Certain information contained herein is derived from information provided by parties other than Homes.com. All information provided is deemed reliable, but is not guaranteed to be accurate and should be independently verified.
![]() Copyright 2026, Houston REALTORS® Information Service, Inc.
Copyright 2026, Houston REALTORS® Information Service, Inc.
The information provided is exclusively for consumers’ personal, non-commercial use, and may not be used for any purpose other than to identify prospective properties consumers may be interested in purchasing.
Information is deemed reliable but not guaranteed.
Ask me questions while you tour the home.