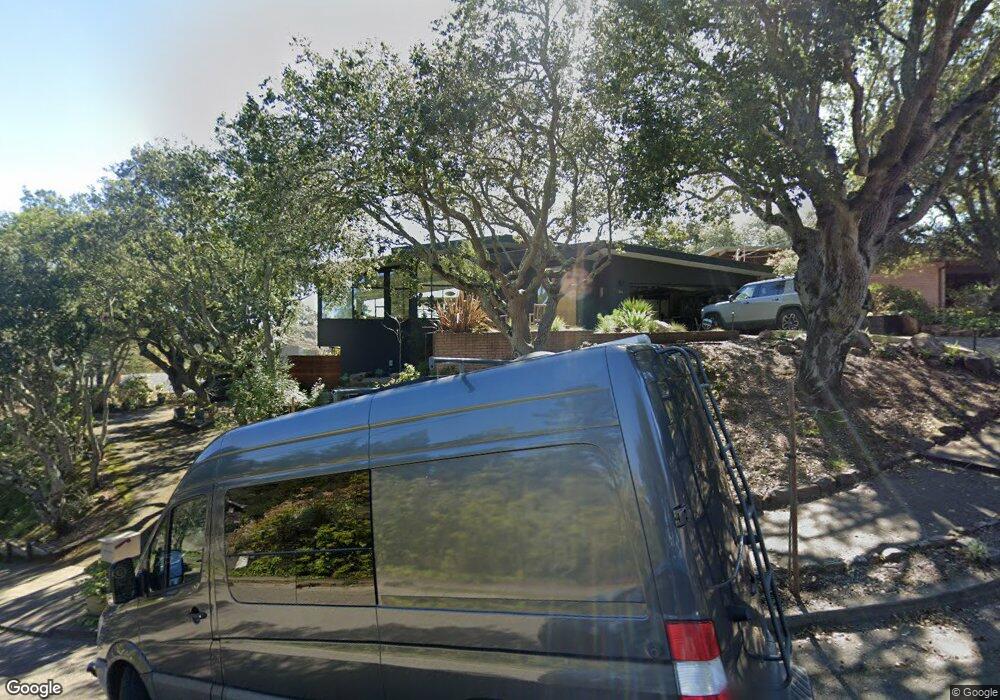
44 Stark Knoll Place Oakland, CA 94618
Upper Rockridge NeighborhoodEstimated Value: $1,913,000 - $2,220,000
4
Beds
3
Baths
2,612
Sq Ft
$783/Sq Ft
Est. Value
About This Home
This home is located at 44 Stark Knoll Place, Oakland, CA 94618 and is currently estimated at $2,046,337, approximately $783 per square foot. 44 Stark Knoll Place is a home located in Alameda County with nearby schools including Hillcrest Elementary School, Skyline High School, and St. Theresa Catholic Elementary School.
Ownership History
Date
Name
Owned For
Owner Type
Purchase Details
Closed on
Nov 14, 2023
Sold by
Chamorro Family Trust
Bought by
Ang Chamorro Family Trust and Ang
Current Estimated Value
Purchase Details
Closed on
Mar 5, 2020
Sold by
Chamorro Michael T and Ang Chamorro Valerie
Bought by
Ang Chamorro Valerie and Chamorro Michael
Purchase Details
Closed on
Jul 3, 2008
Sold by
Malecek Michael J and Malecek Wendy W
Bought by
Chamorro Michael T and Ang Chamorro Valerie
Purchase Details
Closed on
Oct 16, 2002
Sold by
Cosgrove Heller Ephraim and Cosgrove Heller Karen
Bought by
Malecek Michael J and Malecek Wendy W
Home Financials for this Owner
Home Financials are based on the most recent Mortgage that was taken out on this home.
Original Mortgage
$493,250
Interest Rate
6.09%
Purchase Details
Closed on
Jul 13, 1998
Sold by
Eresian Chenok David and Eresian Katherine
Bought by
Cosgrove Heller Ephraim and Cosgrove Heller Karen
Create a Home Valuation Report for This Property
The Home Valuation Report is an in-depth analysis detailing your home's value as well as a comparison with similar homes in the area
Home Values in the Area
Average Home Value in this Area
Purchase History
| Date | Buyer | Sale Price | Title Company |
|---|---|---|---|
| Ang Chamorro Family Trust | -- | None Listed On Document | |
| Ang Chamorro Valerie | -- | None Available | |
| Chamorro Michael T | $1,250,000 | Commonwealth Land Title Co | |
| Malecek Michael J | $835,000 | Old Republic Title Company | |
| Cosgrove Heller Ephraim | $493,500 | -- |
Source: Public Records
Mortgage History
| Date | Status | Borrower | Loan Amount |
|---|---|---|---|
| Previous Owner | Malecek Michael J | $493,250 |
Source: Public Records
Tax History Compared to Growth
Tax History
| Year | Tax Paid | Tax Assessment Tax Assessment Total Assessment is a certain percentage of the fair market value that is determined by local assessors to be the total taxable value of land and additions on the property. | Land | Improvement |
|---|---|---|---|---|
| 2025 | $21,740 | $1,602,587 | $482,876 | $1,126,711 |
| 2024 | $21,740 | $1,571,037 | $473,411 | $1,104,626 |
| 2023 | $23,016 | $1,540,100 | $464,130 | $1,082,970 |
| 2022 | $22,538 | $1,509,774 | $455,032 | $1,061,742 |
| 2021 | $21,830 | $1,480,037 | $446,111 | $1,040,926 |
| 2020 | $21,594 | $1,471,800 | $441,540 | $1,030,260 |
| 2019 | $20,960 | $1,442,950 | $432,885 | $1,010,065 |
| 2018 | $20,516 | $1,414,661 | $424,398 | $990,263 |
| 2017 | $19,799 | $1,386,924 | $416,077 | $970,847 |
| 2016 | $19,315 | $1,359,737 | $407,921 | $951,816 |
| 2015 | $19,221 | $1,339,324 | $401,797 | $937,527 |
| 2014 | $19,631 | $1,313,100 | $393,930 | $919,170 |
Source: Public Records
Map
Nearby Homes
- 5621 Maxwelton Rd
- 100 Sonia St
- 295 Scenic Ave
- 2 Emery Ln
- 5630 Moraga Ave
- 121 Scenic Ave
- 4663 Harbord Dr
- 209 Sheridan Rd
- 97 Clarewood Ln
- 4914 Proctor Ave
- 4614 Jacobus Ave
- 0 0 Ascot Dr Unit 425040144
- 0 3 Ascot Dr Unit 425041613
- 164 Sheridan Rd
- 2058 Oakland Ave
- 110 Sheridan Rd
- 135 Alta Rd
- 164 Duncan Way
- 2026 Oakland Ave
- 415 Pacific Ave
- 24 Stark Knoll Place
- 50 Stark Knoll Place
- 5377 Hilltop Crescent
- 54 Stark Knoll Place
- 5371 Hilltop Crescent
- 39 Stark Knoll Place
- 5365 Hilltop Crescent
- 51 Stark Knoll Place
- 5383 Hilltop Crescent
- 55 Stark Knoll Place
- 15 Stark Knoll Place
- 25 Stark Knoll Place
- 5389 Hilltop Crescent
- 5 Stark Knoll Place
- 5537 Maxwelton Rd
- 5372 Hilltop Crescent
- 5541 Maxwelton Rd
- 5355 Hilltop Crescent
- 5364 Hilltop Crescent
- 198 Maxwelton Rd