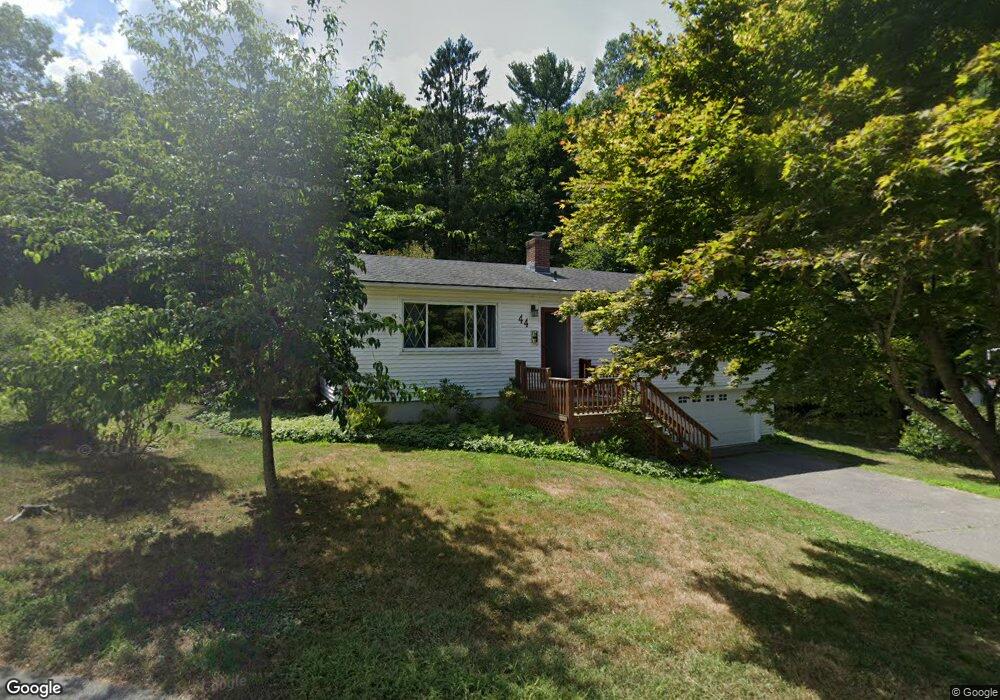
44 Walnut St Torrington, CT 06790
Estimated Value: $262,000 - $290,000
3
Beds
1
Bath
1,248
Sq Ft
$222/Sq Ft
Est. Value
About This Home
This home is located at 44 Walnut St, Torrington, CT 06790 and is currently estimated at $276,802, approximately $221 per square foot. 44 Walnut St is a home located in Litchfield County with nearby schools including Torrington Middle School, Torrington High School, and Brooker Memorial CC & Learning Center.
Ownership History
Date
Name
Owned For
Owner Type
Purchase Details
Closed on
Jul 18, 2023
Sold by
Godburn John E and Godburn Claudia M
Bought by
Lange Valerie M and Lange Jarrad
Current Estimated Value
Home Financials for this Owner
Home Financials are based on the most recent Mortgage that was taken out on this home.
Original Mortgage
$130,000
Outstanding Balance
$126,829
Interest Rate
6.67%
Mortgage Type
Stand Alone Refi Refinance Of Original Loan
Estimated Equity
$149,973
Create a Home Valuation Report for This Property
The Home Valuation Report is an in-depth analysis detailing your home's value as well as a comparison with similar homes in the area
Home Values in the Area
Average Home Value in this Area
Purchase History
| Date | Buyer | Sale Price | Title Company |
|---|---|---|---|
| Lange Valerie M | -- | None Available | |
| Lange Valerie M | -- | None Available |
Source: Public Records
Mortgage History
| Date | Status | Borrower | Loan Amount |
|---|---|---|---|
| Open | Lange Valerie M | $130,000 | |
| Closed | Lange Valerie M | $130,000 |
Source: Public Records
Tax History Compared to Growth
Tax History
| Year | Tax Paid | Tax Assessment Tax Assessment Total Assessment is a certain percentage of the fair market value that is determined by local assessors to be the total taxable value of land and additions on the property. | Land | Improvement |
|---|---|---|---|---|
| 2025 | $6,075 | $157,990 | $24,010 | $133,980 |
| 2024 | $4,260 | $88,810 | $24,010 | $64,800 |
| 2023 | $4,259 | $88,810 | $24,010 | $64,800 |
| 2022 | $4,187 | $88,810 | $24,010 | $64,800 |
| 2021 | $4,100 | $88,810 | $24,010 | $64,800 |
| 2020 | $4,100 | $88,810 | $24,010 | $64,800 |
| 2019 | $4,120 | $89,240 | $29,500 | $59,740 |
| 2018 | $4,120 | $89,240 | $29,500 | $59,740 |
| 2017 | $4,083 | $89,240 | $29,500 | $59,740 |
| 2016 | $4,083 | $89,240 | $29,500 | $59,740 |
| 2015 | $4,083 | $89,240 | $29,500 | $59,740 |
| 2014 | $4,315 | $118,800 | $45,600 | $73,200 |
Source: Public Records
Map
Nearby Homes