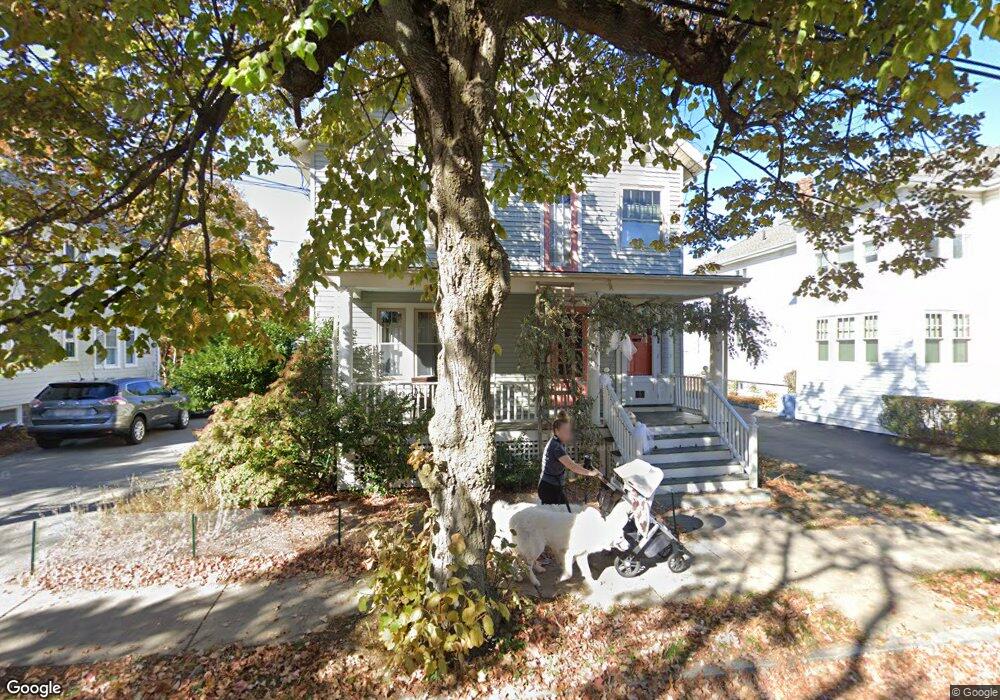
44 Webster St Unit 46 Arlington, MA 02474
Arlington Center NeighborhoodEstimated Value: $1,213,000 - $1,368,443
4
Beds
3
Baths
2,475
Sq Ft
$528/Sq Ft
Est. Value
About This Home
This home is located at 44 Webster St Unit 46, Arlington, MA 02474 and is currently estimated at $1,305,611, approximately $527 per square foot. 44 Webster St Unit 46 is a home located in Middlesex County with nearby schools including Thompson School, Ottoson Middle School, and Arlington High School.
Ownership History
Date
Name
Owned For
Owner Type
Purchase Details
Closed on
Aug 28, 2001
Sold by
Rothenberg Jill M and Moorefield Kelly
Bought by
Moorefield Kelly
Current Estimated Value
Home Financials for this Owner
Home Financials are based on the most recent Mortgage that was taken out on this home.
Original Mortgage
$351,950
Outstanding Balance
$139,439
Interest Rate
7.21%
Mortgage Type
Purchase Money Mortgage
Estimated Equity
$1,166,172
Purchase Details
Closed on
Aug 23, 1996
Sold by
Griffin Thomas W and Griffin Jacqueline M
Bought by
Rothenberg Jill M and Moorefield Kelly
Home Financials for this Owner
Home Financials are based on the most recent Mortgage that was taken out on this home.
Original Mortgage
$247,000
Interest Rate
8.4%
Mortgage Type
Purchase Money Mortgage
Purchase Details
Closed on
May 19, 1987
Sold by
Kenealy William
Bought by
Griffin Thomas W
Home Financials for this Owner
Home Financials are based on the most recent Mortgage that was taken out on this home.
Original Mortgage
$181,900
Interest Rate
9.31%
Mortgage Type
Purchase Money Mortgage
Create a Home Valuation Report for This Property
The Home Valuation Report is an in-depth analysis detailing your home's value as well as a comparison with similar homes in the area
Home Values in the Area
Average Home Value in this Area
Purchase History
| Date | Buyer | Sale Price | Title Company |
|---|---|---|---|
| Moorefield Kelly | $98,915 | -- | |
| Rothenberg Jill M | $260,000 | -- | |
| Griffin Thomas W | $227,400 | -- |
Source: Public Records
Mortgage History
| Date | Status | Borrower | Loan Amount |
|---|---|---|---|
| Open | Griffin Thomas W | $351,950 | |
| Previous Owner | Griffin Thomas W | $246,000 | |
| Previous Owner | Griffin Thomas W | $247,000 | |
| Previous Owner | Griffin Thomas W | $181,900 |
Source: Public Records
Tax History
| Year | Tax Paid | Tax Assessment Tax Assessment Total Assessment is a certain percentage of the fair market value that is determined by local assessors to be the total taxable value of land and additions on the property. | Land | Improvement |
|---|---|---|---|---|
| 2025 | $12,548 | $1,165,100 | $593,400 | $571,700 |
| 2024 | $11,583 | $1,093,800 | $564,900 | $528,900 |
| 2023 | $11,645 | $1,038,800 | $473,600 | $565,200 |
| 2022 | $11,612 | $1,016,800 | $456,500 | $560,300 |
| 2021 | $11,250 | $992,100 | $456,500 | $535,600 |
| 2020 | $10,976 | $992,400 | $456,500 | $535,900 |
| 2019 | $9,968 | $885,300 | $485,000 | $400,300 |
| 2018 | $9,147 | $754,100 | $353,800 | $400,300 |
| 2017 | $8,595 | $684,300 | $308,100 | $376,200 |
| 2016 | $8,175 | $638,700 | $262,500 | $376,200 |
| 2015 | $8,039 | $593,300 | $256,800 | $336,500 |
Source: Public Records
Map
Nearby Homes
- 132 Warren St Unit B
- 26-28 Alton St
- 53 Warren St Unit 53
- 52 Warren St
- 112 Medford St Unit 112
- 68-70 Hamlet St
- 56-58 Adams St Unit 56
- 165 Franklin St Unit 167
- 166 Franklin St Unit 1
- 29 Dartmouth St Unit 29
- 27-29 Dartmouth St Unit 1
- 21 Avon Place
- 48 Mystic Lake Dr Unit 48
- 40 Pleasant St Unit 2
- 199 Everett St Unit 199
- 120 Broadway
- 33 Lombard Rd
- 0 Jerome St Unit 72734260
- 44 Sherman St
- 145 Jerome St
- 44 Webster St Unit 1
- 42 Webster St
- 40 Webster St
- 42 Webster St Unit PH
- 40 Webster St Unit First Floor
- 40-42 Webster St
- 40 Webster St
- 40 Webster St Unit 40
- 42 Webster St Unit 2
- 48 Webster St Unit 50
- 36 Webster St Unit 38
- 45 Webster St Unit 47
- 41 Webster St Unit 43
- 47 Webster St
- 45-47 Webster St Unit 47
- 49 Webster St Unit 51
- 37 Webster St Unit 39
- 53 Webster St
- 52-54 Webster St
- 52 Webster St Unit 54
Your Personal Tour Guide
Ask me questions while you tour the home.