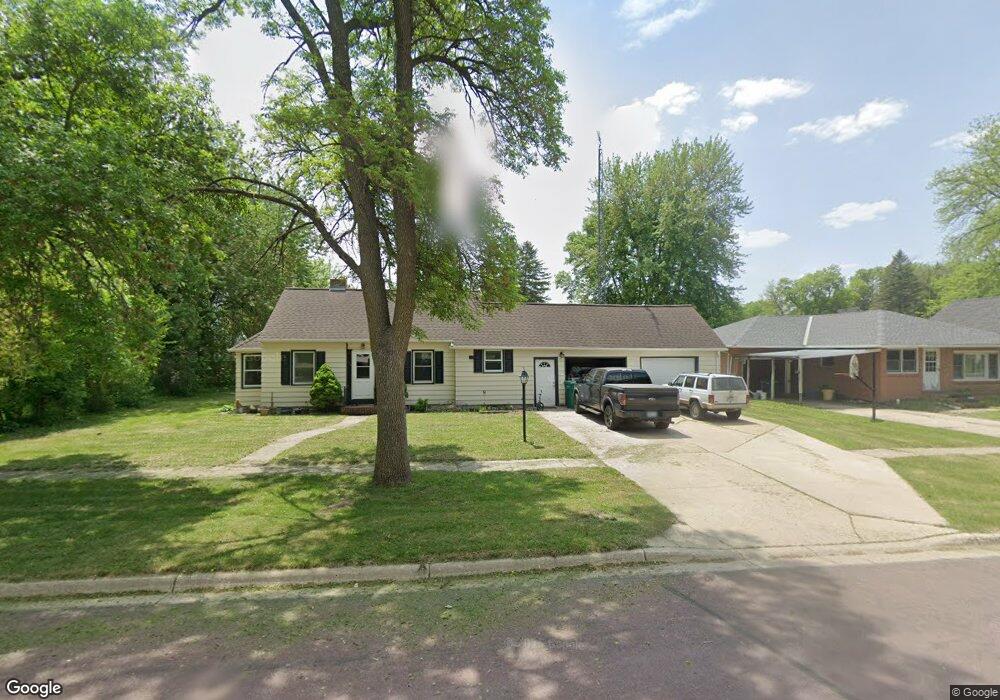
440 Ash St E Trimont, MN 56176
Estimated Value: $101,000 - $121,732
2
Beds
1
Bath
840
Sq Ft
$127/Sq Ft
Est. Value
About This Home
This home is located at 440 Ash St E, Trimont, MN 56176 and is currently estimated at $106,933, approximately $127 per square foot. 440 Ash St E is a home located in Martin County with nearby schools including Trimont Elementary School, Sherburn Elementary School, and Welcome Elementary School.
Ownership History
Date
Name
Owned For
Owner Type
Purchase Details
Closed on
Nov 23, 2016
Sold by
Winchester Chad L and Winchester Chad
Bought by
Altman Lynn S
Current Estimated Value
Home Financials for this Owner
Home Financials are based on the most recent Mortgage that was taken out on this home.
Original Mortgage
$40,000
Outstanding Balance
$18,986
Interest Rate
3.47%
Mortgage Type
Future Advance Clause Open End Mortgage
Estimated Equity
$87,947
Purchase Details
Closed on
Feb 26, 2013
Sold by
Walters Aj A Alanna and Winchester Aj A Alanna
Bought by
Winchester Chad Lucas
Create a Home Valuation Report for This Property
The Home Valuation Report is an in-depth analysis detailing your home's value as well as a comparison with similar homes in the area
Purchase History
| Date | Buyer | Sale Price | Title Company |
|---|---|---|---|
| Altman Lynn S | $50,000 | Jenkinson Abstract Co | |
| Winchester Chad Lucas | -- | None Available |
Source: Public Records
Mortgage History
| Date | Status | Borrower | Loan Amount |
|---|---|---|---|
| Open | Altman Lynn S | $40,000 |
Source: Public Records
Tax History
| Year | Tax Paid | Tax Assessment Tax Assessment Total Assessment is a certain percentage of the fair market value that is determined by local assessors to be the total taxable value of land and additions on the property. | Land | Improvement |
|---|---|---|---|---|
| 2025 | $1,028 | $105,400 | $11,300 | $94,100 |
| 2024 | $792 | $84,100 | $8,800 | $75,300 |
| 2023 | $732 | $76,400 | $4,900 | $71,500 |
| 2022 | $736 | $68,700 | $4,900 | $63,800 |
| 2021 | $724 | $52,500 | $4,900 | $47,600 |
| 2020 | $654 | $52,500 | $4,900 | $47,600 |
| 2019 | $662 | $43,600 | $4,900 | $38,700 |
| 2018 | $616 | $41,100 | $3,900 | $37,200 |
| 2017 | $556 | $24,700 | $2,518 | $22,182 |
| 2016 | $534 | $21,400 | $2,338 | $19,062 |
| 2015 | $522 | $22,500 | $2,340 | $20,160 |
| 2013 | $608 | $25,300 | $2,344 | $22,956 |
Source: Public Records
Map
Nearby Homes
- 341 Main St E
- 51 Chestnut St E
- 180 3rd Ave NE
- 151 Chestnut St E
- 131 Main St E
- 31 Chestnut St E Unit 3
- 31 Chestnut St E Unit 5
- 31 Chestnut St E Unit 2
- 31 Chestnut St E Unit 9
- 31 Chestnut St E Unit 10
- 31 Chestnut St E Unit 4
- 310 1st Ave NE
- 251 Apple St W
- 1178 210th St
- 801 140th St
- 114 1st Ave
- 213 Broadway Ave
- Xxx Lake Shore Dr
- TBD Lake Shore Dr
- 4 S Fox Lake Dr E
Your Personal Tour Guide
Ask me questions while you tour the home.