Estimated Value: $286,000 - $352,000
2
Beds
3
Baths
1,768
Sq Ft
$178/Sq Ft
Est. Value
About This Home
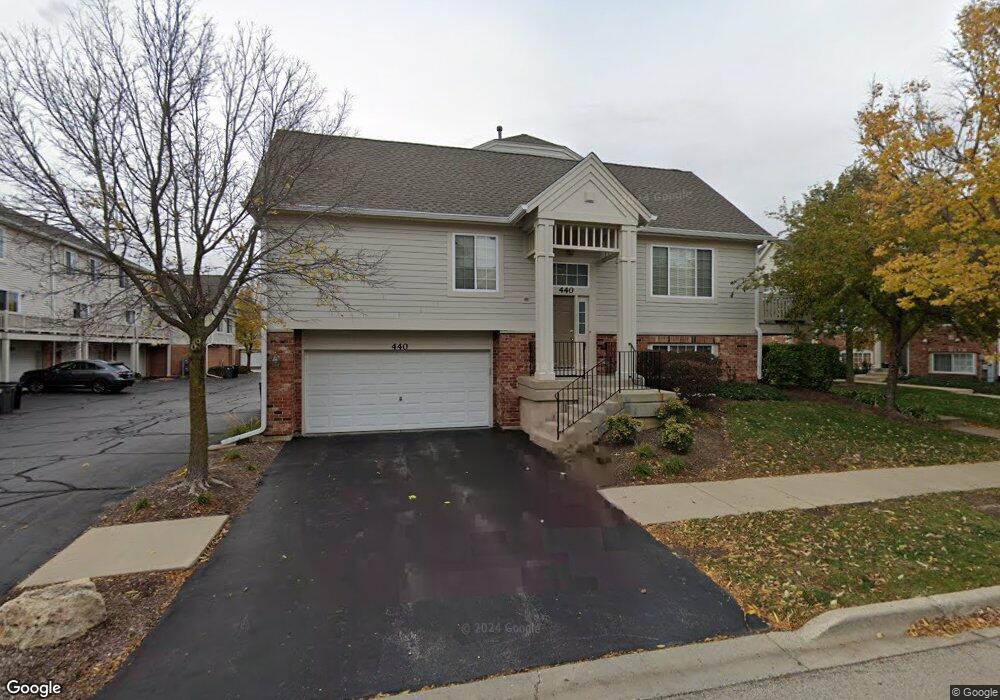
This home is located at 440 Churchill Dr Unit 61, Elgin, IL 60124 and is currently estimated at $314,231, approximately $177 per square foot. 440 Churchill Dr Unit 61 is a home located in Kane County with nearby schools including Country Trails Elementary School, Prairie Knolls Middle School, and Central Middle School.
Ownership History
Date
Name
Owned For
Owner Type
Purchase Details
Closed on
Mar 20, 2017
Sold by
Fannie Mae
Bought by
Balasbas Victor P
Current Estimated Value
Home Financials for this Owner
Home Financials are based on the most recent Mortgage that was taken out on this home.
Original Mortgage
$177,165
Outstanding Balance
$90,368
Interest Rate
4.15%
Mortgage Type
New Conventional
Estimated Equity
$223,863
Purchase Details
Closed on
Apr 11, 2016
Sold by
Simantz Richard and Simantz Elizabeth
Bought by
Federal National Mortgage Association and Fannie Mae
Purchase Details
Closed on
Apr 13, 2007
Sold by
Lennar Community Of Chicago Llc
Bought by
Simantz Richard and Howard Elizabeth
Home Financials for this Owner
Home Financials are based on the most recent Mortgage that was taken out on this home.
Original Mortgage
$22,100
Interest Rate
6.18%
Mortgage Type
Stand Alone Second
Create a Home Valuation Report for This Property
The Home Valuation Report is an in-depth analysis detailing your home's value as well as a comparison with similar homes in the area
Home Values in the Area
Average Home Value in this Area
Purchase History
| Date | Buyer | Sale Price | Title Company |
|---|---|---|---|
| Balasbas Victor P | -- | First American Title | |
| Federal National Mortgage Association | -- | Attorney | |
| Simantz Richard | $222,000 | North American Title Co |
Source: Public Records
Mortgage History
| Date | Status | Borrower | Loan Amount |
|---|---|---|---|
| Open | Balasbas Victor P | $177,165 | |
| Previous Owner | Simantz Richard | $22,100 | |
| Previous Owner | Simantz Richard | $176,800 |
Source: Public Records
Tax History Compared to Growth
Tax History
| Year | Tax Paid | Tax Assessment Tax Assessment Total Assessment is a certain percentage of the fair market value that is determined by local assessors to be the total taxable value of land and additions on the property. | Land | Improvement |
|---|---|---|---|---|
| 2024 | $6,785 | $85,262 | $19,760 | $65,502 |
| 2023 | $6,475 | $77,028 | $17,852 | $59,176 |
| 2022 | $6,154 | $70,236 | $16,278 | $53,958 |
| 2021 | $5,935 | $65,666 | $15,219 | $50,447 |
| 2020 | $5,751 | $62,688 | $14,529 | $48,159 |
| 2019 | $5,565 | $59,714 | $13,840 | $45,874 |
| 2018 | $5,264 | $56,254 | $13,038 | $43,216 |
| 2017 | $5,693 | $53,181 | $12,326 | $40,855 |
| 2016 | $5,704 | $49,337 | $11,435 | $37,902 |
| 2015 | -- | $45,222 | $10,481 | $34,741 |
| 2014 | -- | $44,664 | $10,352 | $34,312 |
| 2013 | -- | $45,842 | $10,625 | $35,217 |
Source: Public Records
Map
Nearby Homes
- 3402 Sanctuary Dr
- 3410 Cameron Dr Unit 34
- 3619 Daisy Ln
- 245 Garden Dr
- 3316 Highwood Ct
- 260 Longview Dr
- 2960 Marshfield Dr
- 1855 Diamond Dr
- 279 Garden Dr
- 3004 Wayland Ave
- 3047 Chalkstone Ave
- 342 Snow Drop Ln
- 2817 Weld Rd
- 3827 Trillium Trail
- 138 Trumpet Vine Cir
- 311 Snowdrop Ln
- 313 Snowdrop Ln
- 262 Snowdrop Ln
- 315 Snowdrop Ln
- 311 Snow Drop Ln
- 450 Churchill Dr Unit 66
- 3383 Cameron Dr Unit 82
- 460 Churchill Dr Unit 72
- 456 Churchill Dr Unit 74
- 458 Churchill Dr Unit 73
- 3385 Cameron Dr Unit 83
- 446 Churchill Dr Unit 64
- 448 Churchill Dr Unit 65
- 462 Churchill Dr Unit 71
- 3391 Cameron Dr Unit 86
- 3389 Cameron Dr Unit 85
- 3387 Cameron Dr Unit 84
- 454 Churchill Dr Unit 75
- 444 Churchill Dr Unit 63
- 442 Churchill Dr Unit 62
- 440 Churchill Dr Unit 440
- 458 Churchill Dr Unit 1
- 3389 Cameron Dr Unit 3389
- 458 Churchill Dr Unit 458
- 460 Churchill Dr Unit 2