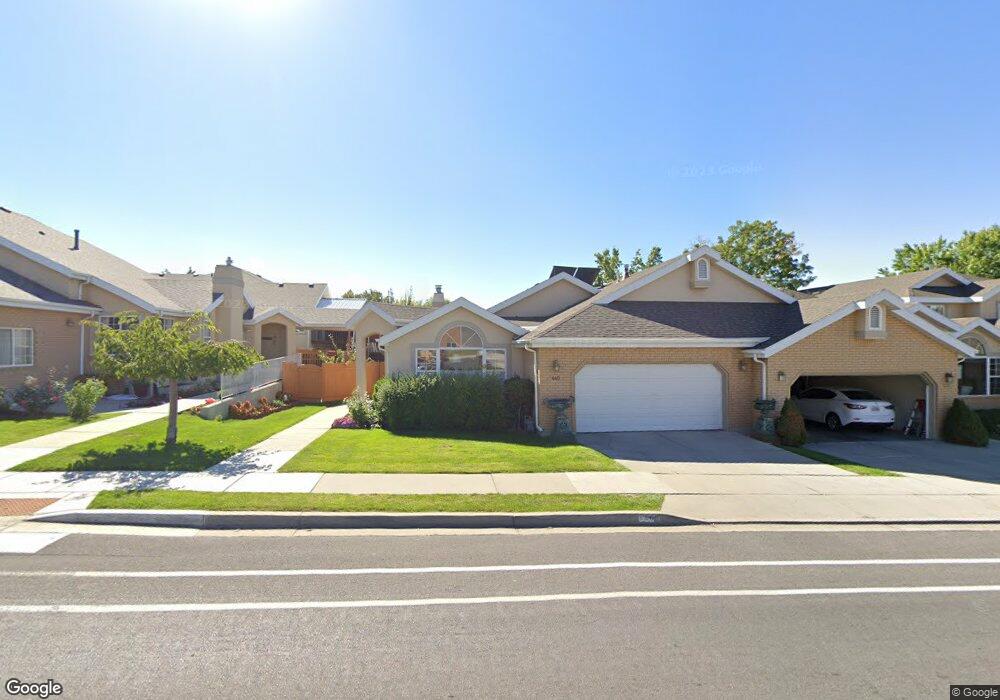
440 E 2320 N Provo, UT 84604
Rock Canyon NeighborhoodEstimated Value: $554,000 - $624,000
5
Beds
4
Baths
3,600
Sq Ft
$164/Sq Ft
Est. Value
About This Home
This home is located at 440 E 2320 N, Provo, UT 84604 and is currently estimated at $592,112, approximately $164 per square foot. 440 E 2320 N is a home located in Utah County with nearby schools including Rock Canyon Elementary School, Centennial Middle School, and Timpview High School.
Ownership History
Date
Name
Owned For
Owner Type
Purchase Details
Closed on
Oct 15, 2024
Sold by
Bridge Family Trust and Bridge Rodney J
Bought by
Bridge Family Trust and Bridge
Current Estimated Value
Purchase Details
Closed on
Oct 21, 2010
Sold by
Brikdge Sally Anna and Brikdge Rodney James
Bought by
Bridge Rodney J and Bridge Sally Ann
Purchase Details
Closed on
Jan 31, 2003
Sold by
Moon J Willis
Bought by
Moody Sally A
Purchase Details
Closed on
Sep 17, 1997
Sold by
Moon J Willis and Moon Pearl F
Bought by
Moon James and Moon Pearl F
Home Financials for this Owner
Home Financials are based on the most recent Mortgage that was taken out on this home.
Original Mortgage
$208,000
Interest Rate
7.45%
Create a Home Valuation Report for This Property
The Home Valuation Report is an in-depth analysis detailing your home's value as well as a comparison with similar homes in the area
Home Values in the Area
Average Home Value in this Area
Purchase History
| Date | Buyer | Sale Price | Title Company |
|---|---|---|---|
| Bridge Family Trust | -- | None Listed On Document | |
| Bridge Rodney J | -- | None Available | |
| Bridge Sally Anna | -- | Accommodation | |
| Moody Sally A | -- | Security Title & Abstract | |
| Moody Sally A | -- | Security Title & Abstract | |
| Moody Sally A | -- | Security Title & Abstract | |
| Moody Sally A | -- | Security Title & Abstract | |
| Moon James | -- | -- |
Source: Public Records
Mortgage History
| Date | Status | Borrower | Loan Amount |
|---|---|---|---|
| Previous Owner | Moon James | $208,000 |
Source: Public Records
Tax History
| Year | Tax Paid | Tax Assessment Tax Assessment Total Assessment is a certain percentage of the fair market value that is determined by local assessors to be the total taxable value of land and additions on the property. | Land | Improvement |
|---|---|---|---|---|
| 2025 | $2,715 | $285,945 | -- | -- |
| 2024 | $2,715 | $267,245 | $0 | $0 |
| 2023 | $2,753 | $267,190 | $0 | $0 |
| 2022 | $2,758 | $269,885 | $0 | $0 |
| 2021 | $2,319 | $395,700 | $47,500 | $348,200 |
| 2020 | $2,287 | $365,800 | $43,900 | $321,900 |
| 2019 | $1,989 | $331,000 | $44,000 | $287,000 |
| 2018 | $1,825 | $307,900 | $37,500 | $270,400 |
| 2017 | $1,739 | $161,260 | $0 | $0 |
| 2016 | $1,728 | $149,325 | $0 | $0 |
| 2015 | $1,709 | $149,325 | $0 | $0 |
| 2014 | $1,640 | $149,325 | $0 | $0 |
Source: Public Records
Map
Nearby Homes
- 240 E 2230 N Unit 7
- 186 E 2100 N
- 1960 N Canyon Rd
- 2774 N 370 E
- 788 E 2680 N
- 360 Sumac Ln
- 2735 N Country Club Dr
- 1801 N 650 E
- 223 W 2230 N Unit 14
- 241 W 2230 N Unit 16
- 3025 N 250 E
- 758 E 3030 N
- 3043 Bannock Dr
- 3013 N 100 W
- 2939 N Marrcrest Dr W
- 2999 N Marrcrest West Dr
- 3057 N 100 W
- 2025 Oak Ln
- 264 W 1625 N
- 3129 Cherokee Ln
Your Personal Tour Guide
Ask me questions while you tour the home.