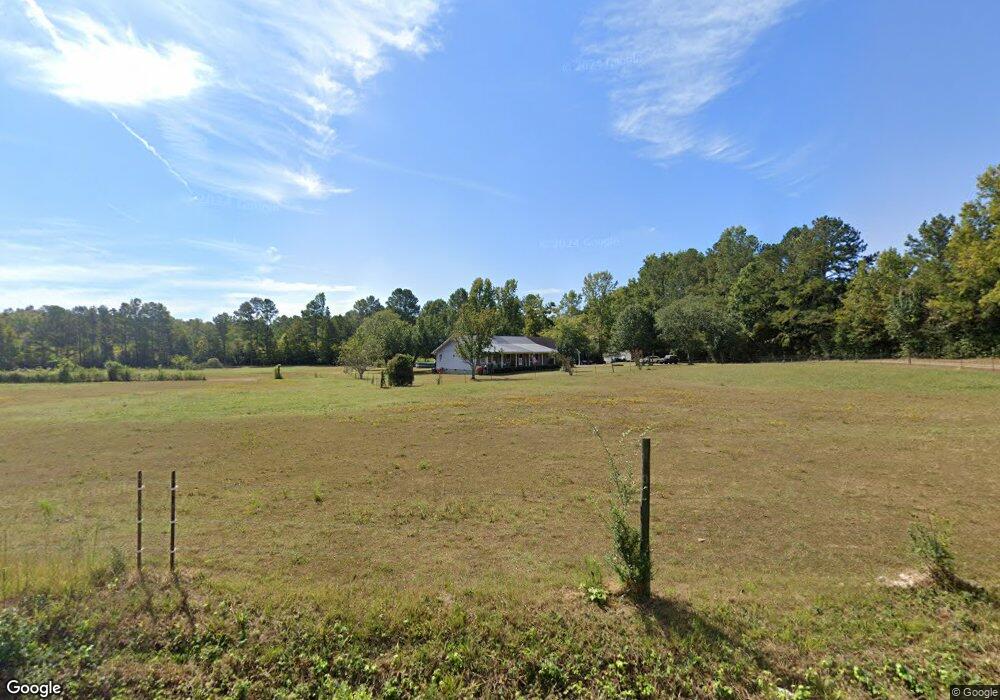
440 Haygood Rd Resaca, GA 30735
Estimated Value: $255,000 - $364,000
--
Bed
2
Baths
1,592
Sq Ft
$191/Sq Ft
Est. Value
About This Home
This home is located at 440 Haygood Rd, Resaca, GA 30735 and is currently estimated at $304,254, approximately $191 per square foot. 440 Haygood Rd is a home located in Murray County with nearby schools including Coker Elementary School, Gladden Middle School, and Murray County High School.
Ownership History
Date
Name
Owned For
Owner Type
Purchase Details
Closed on
Mar 14, 2005
Sold by
Stewart Francina W
Bought by
Gonzalez Carlos A and Gonzalez Serena K
Current Estimated Value
Home Financials for this Owner
Home Financials are based on the most recent Mortgage that was taken out on this home.
Original Mortgage
$38,620
Outstanding Balance
$19,566
Interest Rate
5.6%
Mortgage Type
New Conventional
Estimated Equity
$284,688
Purchase Details
Closed on
Feb 28, 2005
Sold by
Stewart Francina W
Bought by
Gonzalez Carlos A and Gonzalez Serena K
Home Financials for this Owner
Home Financials are based on the most recent Mortgage that was taken out on this home.
Original Mortgage
$38,620
Outstanding Balance
$19,566
Interest Rate
5.6%
Mortgage Type
New Conventional
Estimated Equity
$284,688
Purchase Details
Closed on
Oct 11, 2000
Sold by
Morrow Justin L
Bought by
Stewart Francina W
Purchase Details
Closed on
Oct 29, 1999
Sold by
Boyd John W
Bought by
Morrow Justin L
Purchase Details
Closed on
Nov 1, 1988
Sold by
Walraven Bill
Bought by
Boyd John W
Create a Home Valuation Report for This Property
The Home Valuation Report is an in-depth analysis detailing your home's value as well as a comparison with similar homes in the area
Home Values in the Area
Average Home Value in this Area
Purchase History
| Date | Buyer | Sale Price | Title Company |
|---|---|---|---|
| Gonzalez Carlos A | $193,100 | -- | |
| Gonzalez Carlos A | $193,100 | -- | |
| Stewart Francina W | $155,000 | -- | |
| Morrow Justin L | $148,500 | -- | |
| Boyd John W | -- | -- |
Source: Public Records
Mortgage History
| Date | Status | Borrower | Loan Amount |
|---|---|---|---|
| Open | Gonzalez Carlos A | $38,620 |
Source: Public Records
Tax History Compared to Growth
Tax History
| Year | Tax Paid | Tax Assessment Tax Assessment Total Assessment is a certain percentage of the fair market value that is determined by local assessors to be the total taxable value of land and additions on the property. | Land | Improvement |
|---|---|---|---|---|
| 2024 | $2,208 | $93,876 | $14,080 | $79,796 |
| 2023 | $2,265 | $94,424 | $14,080 | $80,344 |
| 2022 | $1,895 | $78,984 | $8,720 | $70,264 |
| 2021 | $1,630 | $66,264 | $8,720 | $57,544 |
| 2020 | $1,383 | $56,224 | $8,320 | $47,904 |
| 2019 | $1,388 | $56,224 | $8,320 | $47,904 |
| 2018 | $1,388 | $56,224 | $8,320 | $47,904 |
| 2017 | $0 | $51,104 | $8,320 | $42,784 |
| 2016 | $1,129 | $49,744 | $12,200 | $37,544 |
| 2015 | -- | $49,744 | $12,200 | $37,544 |
| 2014 | -- | $49,744 | $12,200 | $37,544 |
| 2013 | -- | $49,744 | $12,200 | $37,544 |
Source: Public Records
Map
Nearby Homes
- 923 County Line Rd
- 715 Mount Zion Rd NE
- 811 Defoor Rd N
- 433 Spring Place Reseca Rd
- 186 Spring Place Rd NE
- 7237 Highway 225 S
- 127 Fog Rd NE
- 0 Nickelsville Rd NW Unit 20148653
- 105 Rustic View Dr NW
- 548 Corinth Rd NE
- 300 Brody Dr NE
- 827 Brackett Ridge Rd
- 155 Greeson Loop NE
- 3959 Nicklesville Rd NE
- 669 Nicklesville Rd NE
- 3961 Nicklesville Rd NE
- 135 Little Creek Ln
- 621 Nicklesville Rd NE
- 993 Sexton Rd
- 2467 Owens Gin Rd NE
- 482 Haygood Rd
- 506 Haygood Rd
- 506 Haygood Rd
- 337 Haygood Rd
- 1275 County Line Rd
- 1141 County Line Rd
- 80 Defoor Rd S
- 0 Haygood Rd
- 1309 County Line Rd
- 108 Defoor Rd S
- 650 Haygood Rd
- 0 County Line Rd Unit 7393531
- 0 County Line Rd Unit 8852751
- 0 County Line Rd Unit 8916708
- 00 County Line Rd
- 0 County Line Rd
- 000 County Line Rd
- 794 County Line Rd NE
- 650 Haygood Rd
- 423 Bowman Dr NE