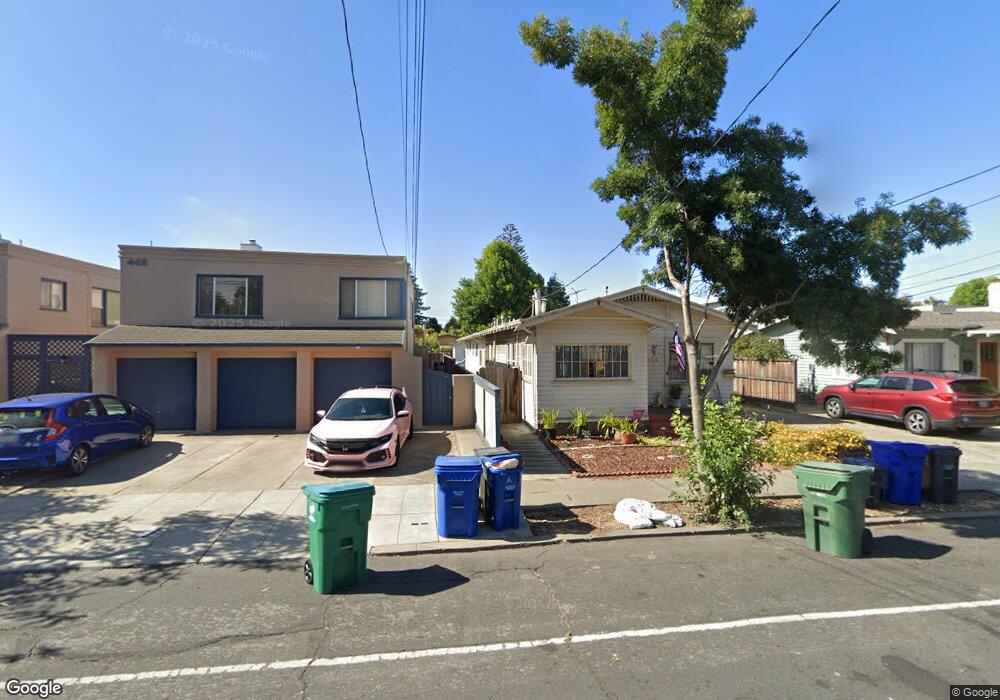
440 Santa Clara Ave Alameda, CA 94501
West Alameda NeighborhoodEstimated Value: $969,000 - $1,215,552
4
Beds
2
Baths
1,389
Sq Ft
$786/Sq Ft
Est. Value
About This Home
This home is located at 440 Santa Clara Ave, Alameda, CA 94501 and is currently estimated at $1,092,276, approximately $786 per square foot. 440 Santa Clara Ave is a home located in Alameda County with nearby schools including William G. Paden Elementary School, Encinal Junior/Senior High, and The Academy of Alameda TK-8 School.
Ownership History
Date
Name
Owned For
Owner Type
Purchase Details
Closed on
Feb 23, 2024
Sold by
Dang Truyen The
Bought by
Dang Trust and Dang
Current Estimated Value
Purchase Details
Closed on
Oct 3, 2002
Sold by
Dang Truyen The
Bought by
Dang Truyen The
Home Financials for this Owner
Home Financials are based on the most recent Mortgage that was taken out on this home.
Original Mortgage
$308,000
Interest Rate
6.17%
Mortgage Type
Commercial
Purchase Details
Closed on
Aug 6, 2001
Sold by
Sommers Carla
Bought by
Dang Truyen The
Home Financials for this Owner
Home Financials are based on the most recent Mortgage that was taken out on this home.
Original Mortgage
$308,000
Interest Rate
7.1%
Mortgage Type
Commercial
Create a Home Valuation Report for This Property
The Home Valuation Report is an in-depth analysis detailing your home's value as well as a comparison with similar homes in the area
Home Values in the Area
Average Home Value in this Area
Purchase History
| Date | Buyer | Sale Price | Title Company |
|---|---|---|---|
| Dang Trust | -- | None Listed On Document | |
| Dang Truyen The | -- | Alliance Title Company | |
| Dang Truyen The | $386,000 | North American Title Co |
Source: Public Records
Mortgage History
| Date | Status | Borrower | Loan Amount |
|---|---|---|---|
| Previous Owner | Dang Truyen The | $308,000 | |
| Previous Owner | Dang Truyen The | $308,000 |
Source: Public Records
Tax History Compared to Growth
Tax History
| Year | Tax Paid | Tax Assessment Tax Assessment Total Assessment is a certain percentage of the fair market value that is determined by local assessors to be the total taxable value of land and additions on the property. | Land | Improvement |
|---|---|---|---|---|
| 2025 | $9,330 | $570,198 | $171,059 | $399,139 |
| 2024 | $9,330 | $559,020 | $167,706 | $391,314 |
| 2023 | $8,986 | $548,061 | $164,418 | $383,643 |
| 2022 | $8,783 | $537,315 | $161,194 | $376,121 |
| 2021 | $8,570 | $526,781 | $158,034 | $368,747 |
| 2020 | $8,460 | $521,381 | $156,414 | $364,967 |
| 2019 | $7,958 | $511,160 | $153,348 | $357,812 |
| 2018 | $7,760 | $501,138 | $150,341 | $350,797 |
| 2017 | $7,423 | $491,315 | $147,394 | $343,921 |
| 2016 | $7,414 | $481,684 | $144,505 | $337,179 |
| 2015 | $7,379 | $474,451 | $142,335 | $332,116 |
| 2014 | $7,192 | $465,160 | $139,548 | $325,612 |
Source: Public Records
Map
Nearby Homes
- 461 Central Ave
- 333 Central Ave
- 343 Lincoln Ave
- 537 Pacific Ave
- 1230 Ballena Blvd
- 1229 Ballena Blvd
- 549 Pacific Ave
- 553 Kings Rd Unit 36
- 310 Spruce St
- 1327 Webster St Unit B210
- 1327 Webster St Unit B101
- 219 Cypress St Unit K
- 1321 Webster St Unit D303
- 1321 Webster St Unit D116
- 1321 Webster St Unit D119
- 1333 Webster St Unit A107
- 1710 2nd St
- 8 Sanderling Ct
- 711 Haight Ave
- 1305 Webster St Unit C309
- 438 Santa Clara Ave
- 448 Santa Clara Ave
- 436 Santa Clara Ave
- 450 Santa Clara Ave
- 432 Santa Clara Ave
- 452 Santa Clara Ave
- 441 Taylor Ave
- 439 Taylor Ave
- 447 Taylor Ave
- 433 Taylor Ave
- 430 Santa Clara Ave
- 456 Santa Clara Ave
- 451 Taylor Ave
- 431 Taylor Ave
- 453 Taylor Ave
- 441 Santa Clara Ave
- 439 Santa Clara Ave
- 443 Santa Clara Ave
- 458 Santa Clara Ave
- 437 Santa Clara Ave