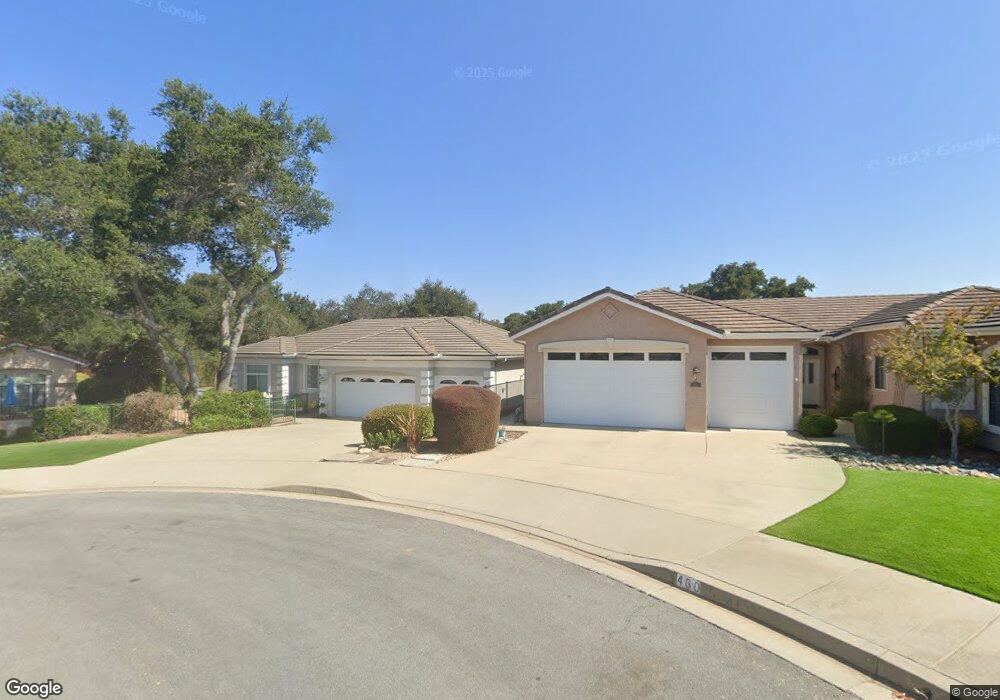
440 Tee Ct Unit 1 Nipomo, CA 93444
Blacklake NeighborhoodEstimated Value: $836,913 - $989,000
2
Beds
2
Baths
1,690
Sq Ft
$542/Sq Ft
Est. Value
About This Home
This home is located at 440 Tee Ct Unit 1, Nipomo, CA 93444 and is currently estimated at $915,978, approximately $541 per square foot. 440 Tee Ct Unit 1 is a home located in San Luis Obispo County with nearby schools including Dorothea Lange Elementary School, Mesa Middle School, and Nipomo High School.
Ownership History
Date
Name
Owned For
Owner Type
Purchase Details
Closed on
Jun 12, 2012
Sold by
Mallett Family Revocable Living Trust
Bought by
Mallett Duward William and Mallett Sena Louise
Current Estimated Value
Home Financials for this Owner
Home Financials are based on the most recent Mortgage that was taken out on this home.
Original Mortgage
$150,000
Outstanding Balance
$22,125
Interest Rate
3.74%
Mortgage Type
New Conventional
Estimated Equity
$893,853
Purchase Details
Closed on
Sep 19, 2006
Sold by
Mallett D William D and Mallett Sena L
Bought by
Mallett Duward William and Mallett Sena Louise
Purchase Details
Closed on
Jul 22, 1998
Sold by
Blacklake Estates Partners Lp
Bought by
Mallett D William and Mallett Sena J
Create a Home Valuation Report for This Property
The Home Valuation Report is an in-depth analysis detailing your home's value as well as a comparison with similar homes in the area
Home Values in the Area
Average Home Value in this Area
Purchase History
| Date | Buyer | Sale Price | Title Company |
|---|---|---|---|
| Mallett Duward William | -- | Chicago Title | |
| Mallett Duward William | -- | None Available | |
| Mallett D William | $283,000 | First American Title Ins Co |
Source: Public Records
Mortgage History
| Date | Status | Borrower | Loan Amount |
|---|---|---|---|
| Open | Mallett Duward William | $150,000 |
Source: Public Records
Tax History
| Year | Tax Paid | Tax Assessment Tax Assessment Total Assessment is a certain percentage of the fair market value that is determined by local assessors to be the total taxable value of land and additions on the property. | Land | Improvement |
|---|---|---|---|---|
| 2025 | $5,676 | $443,488 | $219,473 | $224,015 |
| 2024 | $5,631 | $434,793 | $215,170 | $219,623 |
| 2023 | $5,631 | $426,268 | $210,951 | $215,317 |
| 2022 | $5,573 | $417,911 | $206,815 | $211,096 |
| 2021 | $4,410 | $409,717 | $202,760 | $206,957 |
| 2020 | $4,359 | $405,516 | $200,681 | $204,835 |
| 2019 | $4,331 | $397,566 | $196,747 | $200,819 |
| 2018 | $4,279 | $389,772 | $192,890 | $196,882 |
| 2017 | $4,192 | $382,130 | $189,108 | $193,022 |
| 2016 | $3,955 | $374,638 | $185,400 | $189,238 |
| 2015 | $3,898 | $369,012 | $182,616 | $186,396 |
| 2014 | $3,753 | $361,784 | $179,039 | $182,745 |
Source: Public Records
Map
Nearby Homes
- 1160 Oakmont Place Unit 1
- 1337 Black Sage Cir
- 639 Barberry Way
- 1212 Black Sage Cir
- 1525 Hogan Ct
- 1625 Sarazen Ct
- 1276 Pomeroy Rd
- 780 Conestoga Ln
- 678 Woodgreen Way
- 1060 Dawn Rd
- 462 Camino Perillo
- 940 Calle Fresa
- 1003 Joseph Ct
- 1642 Northwood Rd
- 931 Jacqueline Place
- 808 Albert Way
- 708 Albert Way
- 1071 Ford Dr
- 957 Jacqueline Place
- 1658 Waterview Place
- 460 Tee Ct Unit 1
- 445 Tee Ct
- 480 Colonial Place Unit 1
- 465 Tee Ct
- 490 Colonial Place
- 470 Colonial Place
- 460 Colonial Place
- 496 Colonial Place Unit 1
- 485 Colonial Place
- 450 Colonial Place Unit 1
- 475 Colonial Place
- 495 Colonial Place
- 465 Colonial Place
- 1244 Saint Andrews Way
- 440 Colonial Place
- 455 Colonial Place
- 1248 Saint Andrews Way
- 1252 Saint Andrews Way
- 445 Colonial Place
Your Personal Tour Guide
Ask me questions while you tour the home.