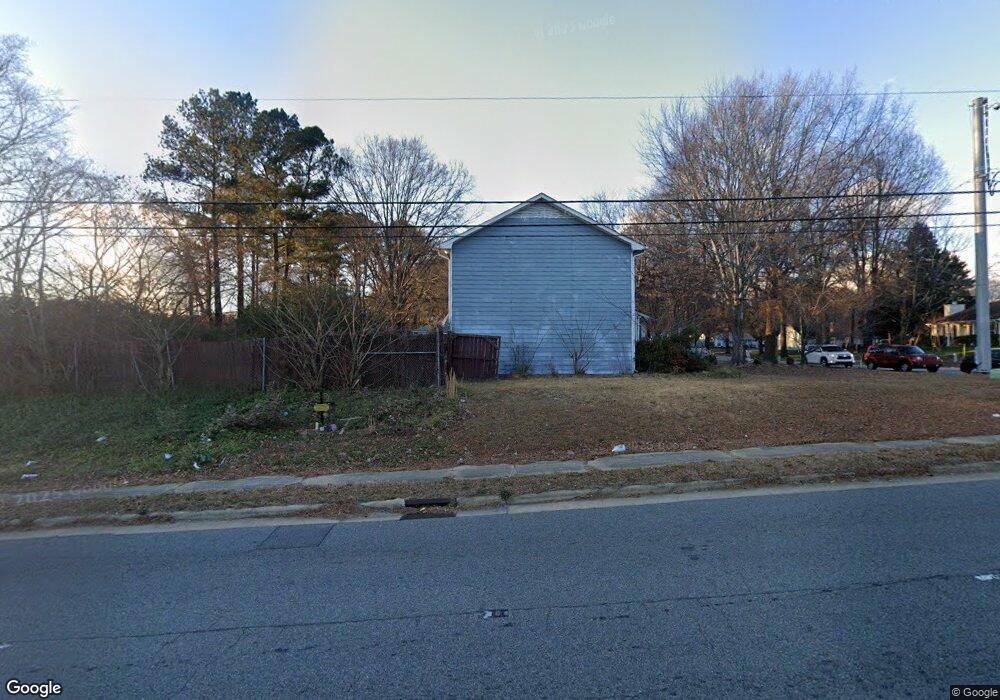
4401 Fox Rd Raleigh, NC 27616
Northeast Raleigh NeighborhoodEstimated Value: $314,000 - $347,451
3
Beds
3
Baths
1,812
Sq Ft
$185/Sq Ft
Est. Value
About This Home
This home is located at 4401 Fox Rd, Raleigh, NC 27616 and is currently estimated at $334,363, approximately $184 per square foot. 4401 Fox Rd is a home located in Wake County with nearby schools including River Bend Elementary, River Bend Middle, and Rolesville High School.
Ownership History
Date
Name
Owned For
Owner Type
Purchase Details
Closed on
May 21, 2018
Sold by
Garland Richard E and Garland Frances D
Bought by
Graffam Dean Edward and Graffam Latria E
Current Estimated Value
Home Financials for this Owner
Home Financials are based on the most recent Mortgage that was taken out on this home.
Original Mortgage
$189,900
Outstanding Balance
$163,510
Interest Rate
4.4%
Mortgage Type
New Conventional
Estimated Equity
$170,853
Purchase Details
Closed on
Mar 26, 1999
Sold by
Va
Bought by
Garland Richard E and Garland Frances D
Home Financials for this Owner
Home Financials are based on the most recent Mortgage that was taken out on this home.
Original Mortgage
$130,500
Interest Rate
6.75%
Mortgage Type
Seller Take Back
Purchase Details
Closed on
Dec 8, 1998
Sold by
Peters James W
Bought by
Va
Purchase Details
Closed on
Nov 30, 1995
Bought by
Garland Richard E and Garland Frances D
Create a Home Valuation Report for This Property
The Home Valuation Report is an in-depth analysis detailing your home's value as well as a comparison with similar homes in the area
Home Values in the Area
Average Home Value in this Area
Purchase History
| Date | Buyer | Sale Price | Title Company |
|---|---|---|---|
| Graffam Dean Edward | $190,000 | None Available | |
| Garland Richard E | -- | -- | |
| Va | $105,344 | -- | |
| Garland Richard E | $118,000 | -- |
Source: Public Records
Mortgage History
| Date | Status | Borrower | Loan Amount |
|---|---|---|---|
| Open | Graffam Dean Edward | $189,900 | |
| Previous Owner | Garland Richard E | $130,500 |
Source: Public Records
Tax History
| Year | Tax Paid | Tax Assessment Tax Assessment Total Assessment is a certain percentage of the fair market value that is determined by local assessors to be the total taxable value of land and additions on the property. | Land | Improvement |
|---|---|---|---|---|
| 2025 | $3,071 | $349,895 | $99,000 | $250,895 |
| 2024 | $3,059 | $349,895 | $99,000 | $250,895 |
Source: Public Records
Map
Nearby Homes
- 5016 Kyle Dr
- 5320 Spring Pines Way
- 5401 Razan St
- 4715 Jelynn St
- 4715 Mallory Ct
- 4604 Lavista Ct Unit A & B
- 5009 Silverdene St
- 4400 Cottage Stone Dr
- 5012 Silverdene St
- 4828 Mocha Ln
- 5004 Silverdene St
- 4804 Spring Forest Rd
- 4408 Moss Spring Dr
- 4701 Tommans Trail
- 4721 Mocha Ln
- 5015 Croftwood Dr
- 5315 Eagles Landing Dr
- 4200 James Rd
- 4217 James Rd
- 5405 Eagles Landing Dr
Your Personal Tour Guide
Ask me questions while you tour the home.