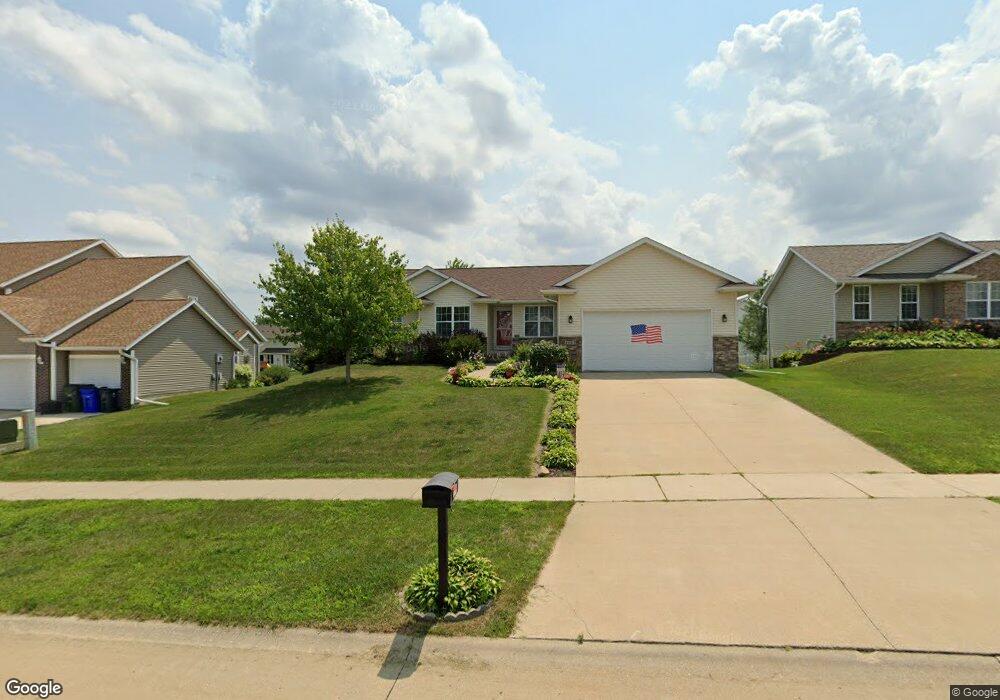
4401 Spring Meadow Place NE Cedar Rapids, IA 52411
Estimated Value: $351,000 - $380,000
4
Beds
4
Baths
1,410
Sq Ft
$264/Sq Ft
Est. Value
About This Home
This home is located at 4401 Spring Meadow Place NE, Cedar Rapids, IA 52411 and is currently estimated at $372,110, approximately $263 per square foot. 4401 Spring Meadow Place NE is a home located in Linn County with nearby schools including Viola Gibson Elementary School, Ponderosa Elementary School, and Harding Middle School.
Ownership History
Date
Name
Owned For
Owner Type
Purchase Details
Closed on
Jan 31, 2006
Sold by
Burington Eldo J and Burington Joyce A
Bought by
Burington Eldo J
Current Estimated Value
Purchase Details
Closed on
Apr 18, 2005
Sold by
Akers Construction Llc
Bought by
Nigg Daniel W and Nigg Theresa D
Home Financials for this Owner
Home Financials are based on the most recent Mortgage that was taken out on this home.
Original Mortgage
$171,751
Outstanding Balance
$89,263
Interest Rate
5.89%
Mortgage Type
Fannie Mae Freddie Mac
Estimated Equity
$282,847
Purchase Details
Closed on
Oct 12, 2004
Sold by
Ridgewood Llc
Bought by
Akers Construction Llc
Home Financials for this Owner
Home Financials are based on the most recent Mortgage that was taken out on this home.
Original Mortgage
$168,000
Interest Rate
5.89%
Mortgage Type
Construction
Create a Home Valuation Report for This Property
The Home Valuation Report is an in-depth analysis detailing your home's value as well as a comparison with similar homes in the area
Home Values in the Area
Average Home Value in this Area
Purchase History
| Date | Buyer | Sale Price | Title Company |
|---|---|---|---|
| Burington Eldo J | -- | None Available | |
| Nigg Daniel W | $214,500 | -- | |
| Akers Construction Llc | $45,000 | -- |
Source: Public Records
Mortgage History
| Date | Status | Borrower | Loan Amount |
|---|---|---|---|
| Open | Nigg Daniel W | $171,751 | |
| Previous Owner | Akers Construction Llc | $168,000 |
Source: Public Records
Tax History Compared to Growth
Tax History
| Year | Tax Paid | Tax Assessment Tax Assessment Total Assessment is a certain percentage of the fair market value that is determined by local assessors to be the total taxable value of land and additions on the property. | Land | Improvement |
|---|---|---|---|---|
| 2025 | $5,394 | $335,800 | $76,800 | $259,000 |
| 2024 | $5,712 | $323,900 | $72,700 | $251,200 |
| 2023 | $5,712 | $323,900 | $72,700 | $251,200 |
| 2022 | $5,158 | $283,100 | $62,600 | $220,500 |
| 2021 | $5,240 | $261,400 | $58,600 | $202,800 |
| 2020 | $5,240 | $249,400 | $48,500 | $200,900 |
| 2019 | $5,030 | $245,100 | $48,500 | $196,600 |
| 2018 | $4,884 | $245,100 | $48,500 | $196,600 |
| 2017 | $4,789 | $241,800 | $48,500 | $193,300 |
| 2016 | $4,789 | $228,600 | $48,500 | $180,100 |
| 2015 | $4,947 | $235,831 | $48,480 | $187,351 |
| 2014 | $4,762 | $224,324 | $48,480 | $175,844 |
| 2013 | $4,414 | $224,324 | $48,480 | $175,844 |
Source: Public Records
Map
Nearby Homes
- 4301 Viola St NE
- 6312 Casey Ln NE
- 2420 Heritage Green Dr
- 2255 Blairsferry Crossing
- 225 Ridgewood Dr
- 6524 Michael Dr NE
- Lot 1A Buffalo Ridge Dr NE
- 5843 Wells Ln
- 4620 Prairie Stone Dr NE
- 4408 Prairie Stone Dr NE
- 4510 Prairie Stone Dr NE
- 5515 W Mustang Rd
- 5854 Wells Ln
- 6718 Lauder Ln
- 5180 Chestnut Valley Rd
- 4620 N River Blvd NE
- Lot 11 Cross Pointe Blvd NE
- Lot 12 Cross Pointe Blvd NE
- 6720 Caldwell Ln
- 2596 Anne Ln
- 4323 Spring Meadow Place NE
- 4407 Spring Meadow Place NE
- 4404 Viola St NE
- 4317 Spring Meadow Place NE
- 4320 Viola St NE
- 4410 Viola St NE
- 4413 Spring Meadow Place NE
- 4402 Spring Meadow Place NE
- 4408 Spring Meadow Place NE
- 4314 Viola St NE
- 4416 Viola St NE
- 4318 Spring Meadow Place NE
- 4311 Spring Meadow Place NE
- 4414 Spring Meadow Place NE
- 4312 Spring Meadow Place NE
- 4308 Viola St NE
- 4305 Spring Meadow Place NE
- 4306 Spring Meadow Place NE
- 4624 Holly Cir NE
- 4405 Viola St NE