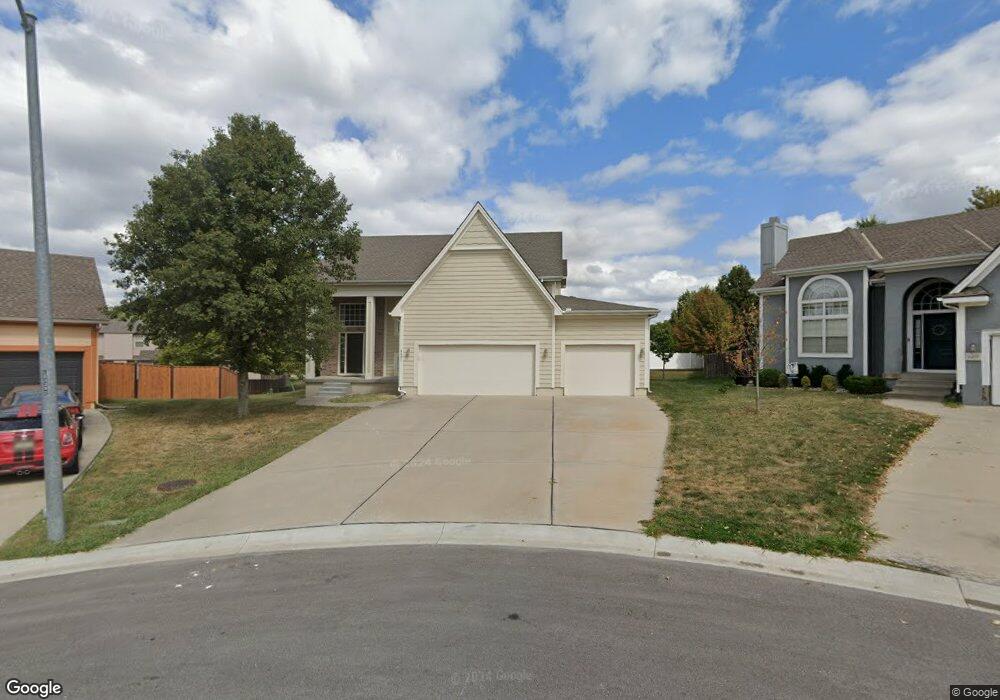
4401 SW Lyndsie Ct Lees Summit, MO 64082
Estimated Value: $406,000 - $487,000
3
Beds
3
Baths
2,068
Sq Ft
$213/Sq Ft
Est. Value
About This Home
This home is located at 4401 SW Lyndsie Ct, Lees Summit, MO 64082 and is currently estimated at $439,822, approximately $212 per square foot. 4401 SW Lyndsie Ct is a home located in Jackson County with nearby schools including Summit Pointe Elementary School, Summit Lakes Middle School, and Lee's Summit West High School.
Ownership History
Date
Name
Owned For
Owner Type
Purchase Details
Closed on
Aug 19, 2008
Sold by
Troyer Eugene and Troyer Amber B
Bought by
Vaughn Melissa D
Current Estimated Value
Home Financials for this Owner
Home Financials are based on the most recent Mortgage that was taken out on this home.
Original Mortgage
$161,500
Outstanding Balance
$105,788
Interest Rate
6.29%
Mortgage Type
Purchase Money Mortgage
Estimated Equity
$334,034
Purchase Details
Closed on
Dec 18, 2006
Sold by
Mcgovern Builders Inc
Bought by
Troyer Amber B and Troyer Eugene
Home Financials for this Owner
Home Financials are based on the most recent Mortgage that was taken out on this home.
Original Mortgage
$180,720
Interest Rate
8.45%
Mortgage Type
Purchase Money Mortgage
Purchase Details
Closed on
Apr 17, 2006
Sold by
Stoney Creek Development Llc
Bought by
Mcgovern Builders Inc
Home Financials for this Owner
Home Financials are based on the most recent Mortgage that was taken out on this home.
Original Mortgage
$187,595
Interest Rate
6.32%
Mortgage Type
Construction
Create a Home Valuation Report for This Property
The Home Valuation Report is an in-depth analysis detailing your home's value as well as a comparison with similar homes in the area
Home Values in the Area
Average Home Value in this Area
Purchase History
| Date | Buyer | Sale Price | Title Company |
|---|---|---|---|
| Vaughn Melissa D | -- | Metro One Title | |
| Troyer Amber B | -- | Coffelt Land Title Inc | |
| Mcgovern Builders Inc | -- | Coffelt Land Title Inc |
Source: Public Records
Mortgage History
| Date | Status | Borrower | Loan Amount |
|---|---|---|---|
| Open | Vaughn Melissa D | $161,500 | |
| Previous Owner | Troyer Amber B | $180,720 | |
| Previous Owner | Mcgovern Builders Inc | $187,595 |
Source: Public Records
Tax History Compared to Growth
Tax History
| Year | Tax Paid | Tax Assessment Tax Assessment Total Assessment is a certain percentage of the fair market value that is determined by local assessors to be the total taxable value of land and additions on the property. | Land | Improvement |
|---|---|---|---|---|
| 2025 | $5,118 | $70,608 | $15,628 | $54,980 |
| 2024 | $5,080 | $70,874 | $11,860 | $59,014 |
| 2023 | $5,080 | $70,874 | $11,064 | $59,810 |
| 2022 | $4,310 | $53,390 | $6,204 | $47,186 |
| 2021 | $4,399 | $53,390 | $6,204 | $47,186 |
| 2020 | $4,229 | $50,825 | $6,204 | $44,621 |
| 2019 | $4,113 | $50,825 | $6,204 | $44,621 |
| 2018 | $1,682,226 | $44,234 | $5,399 | $38,835 |
| 2017 | $3,858 | $44,234 | $5,399 | $38,835 |
| 2016 | $3,660 | $41,534 | $6,517 | $35,017 |
| 2014 | $3,715 | $41,336 | $6,517 | $34,819 |
Source: Public Records
Map
Nearby Homes
- 4510 SW Fenwick Rd
- 4400 SW Rivulet Dr
- 1022 SW Cheshire Dr
- 4120 SW Flintrock Dr
- 1021 SW Cheshire Dr
- 4104 SW Flintrock Dr
- Serenade Plan at Stoney Creek - Bliss Collection
- Oasis Plan at Stoney Creek - Bliss Collection
- Devotion Plan at Stoney Creek - Bliss Collection
- Brookside Plan at Stoney Creek - Premier Collection
- Serenity Plan at Stoney Creek - Bliss Collection
- Avalon Plan at Stoney Creek - Premier Collection
- Harmony Plan at Stoney Creek - Bliss Collection
- 1937 SW Merryman Dr
- Lexington Plan at Stoney Creek - Premier Collection
- Crestwood Plan at Stoney Creek - Premier Collection
- 4520 SW Berkshire Dr
- 1423 SW Fairfax Rd
- 4528 SW Berkshire Dr
- 1520 SW 41st St
- 4405 SW Lyndsie Ct
- 4400 SW Lyndsie Ct
- 1307 SW Georgetown Dr
- 1303 SW Georgetown Dr
- 1311 SW Georgetown Dr
- 4409 SW Lyndsie Ct
- 4404 SW Lyndsie Ct
- 4420 SW Creekview Dr
- 4424 SW Creekview Dr
- 4408 SW Lyndsie Ct
- 1306 SW Georgetown Dr
- 4428 SW Creekview Dr
- 4416 SW Creekview Dr
- 4413 SW Lyndsie Ct
- 1302 SW Georgetown Dr
- 4409 SW Flintrock Dr
- 4412 SW Lyndsie Ct
- 4405 SW Flintrock Dr
- 4432 SW Creekview Dr
- 1310 SW Georgetown Dr