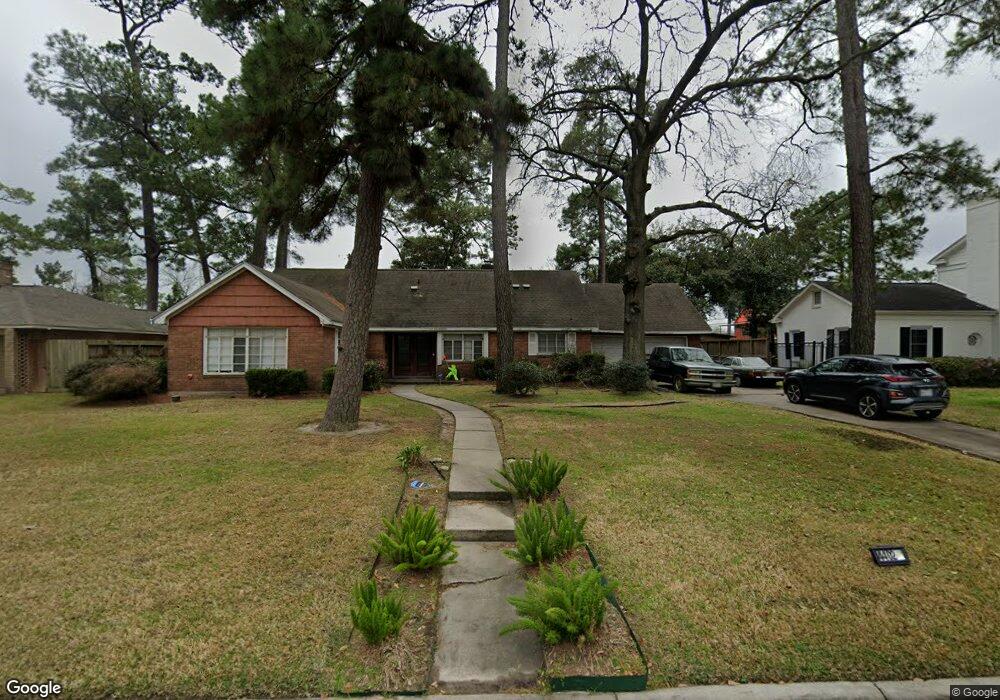
4402 Laurel Dr Houston, TX 77021
MacGregor NeighborhoodEstimated Value: $388,184 - $518,000
4
Beds
2
Baths
1,819
Sq Ft
$246/Sq Ft
Est. Value
About This Home
This home is located at 4402 Laurel Dr, Houston, TX 77021 and is currently estimated at $447,296, approximately $245 per square foot. 4402 Laurel Dr is a home located in Harris County with nearby schools including Peck Elementary School, Cullen Middle School, and Yates High School.
Ownership History
Date
Name
Owned For
Owner Type
Purchase Details
Closed on
Jun 3, 2022
Sold by
Eric Wilson Chad
Bought by
Wilson Candice Chelle
Current Estimated Value
Home Financials for this Owner
Home Financials are based on the most recent Mortgage that was taken out on this home.
Original Mortgage
$100,000
Interest Rate
5.81%
Mortgage Type
Seller Take Back
Purchase Details
Closed on
Aug 31, 2004
Sold by
Hall Kinard Helen M
Bought by
Wilson Chad and Porter Candice
Home Financials for this Owner
Home Financials are based on the most recent Mortgage that was taken out on this home.
Original Mortgage
$100,000
Interest Rate
5.97%
Mortgage Type
Purchase Money Mortgage
Purchase Details
Closed on
Jun 25, 1999
Sold by
Wade Mitzi Michell Bell
Bought by
Hall Kinard Helen M
Purchase Details
Closed on
Jun 8, 1999
Sold by
Bell Emmitt D
Bought by
Hall Kinard Helen M
Purchase Details
Closed on
May 27, 1999
Sold by
Hall Egbert Henry
Bought by
Hall Kinard Helen M
Create a Home Valuation Report for This Property
The Home Valuation Report is an in-depth analysis detailing your home's value as well as a comparison with similar homes in the area
Home Values in the Area
Average Home Value in this Area
Purchase History
| Date | Buyer | Sale Price | Title Company |
|---|---|---|---|
| Wilson Candice Chelle | $100,000 | None Listed On Document | |
| Wilson Chad | -- | First American Title | |
| Hall Kinard Helen M | -- | -- | |
| Hall Kinard Helen M | -- | -- | |
| Hall Kinard Helen M | -- | -- |
Source: Public Records
Mortgage History
| Date | Status | Borrower | Loan Amount |
|---|---|---|---|
| Previous Owner | Wilson Candice Chelle | $100,000 | |
| Previous Owner | Wilson Chad | $100,000 |
Source: Public Records
Tax History Compared to Growth
Tax History
| Year | Tax Paid | Tax Assessment Tax Assessment Total Assessment is a certain percentage of the fair market value that is determined by local assessors to be the total taxable value of land and additions on the property. | Land | Improvement |
|---|---|---|---|---|
| 2025 | $5,572 | $386,935 | $297,500 | $89,435 |
| 2024 | $5,572 | $386,935 | $297,500 | $89,435 |
| 2023 | $5,572 | $387,306 | $297,500 | $89,806 |
| 2022 | $7,354 | $378,423 | $297,500 | $80,923 |
| 2021 | $6,725 | $288,559 | $212,500 | $76,059 |
| 2020 | $6,916 | $277,066 | $212,500 | $64,566 |
| 2019 | $6,557 | $247,848 | $183,282 | $64,566 |
| 2018 | $4,385 | $230,351 | $159,375 | $70,976 |
| 2017 | $6,089 | $230,351 | $159,375 | $70,976 |
| 2016 | $5,729 | $230,351 | $159,375 | $70,976 |
| 2015 | $3,728 | $196,999 | $116,875 | $80,124 |
| 2014 | $3,728 | $189,029 | $116,875 | $72,154 |
Source: Public Records
Map
Nearby Homes
- 4310 Fernwood Dr
- 4302 Fernwood Dr
- 4327 Alconbury Ln
- 4315 Fernwood Dr
- 4435 Old Spanish Trail
- 4211 Charleston St
- 4107 Charleston St
- 0 S Macgregor Way Unit 94380145
- 4031 Fernwood Dr
- 4711 Marietta Ln
- 4735 Marietta Ln
- 4014 England Ct E
- 5811 Eastwood St
- 4826 Culmore Dr
- 3917, 3919 Griggs Rd
- 4807 Eppes St
- 4838 Marietta Ln
- 4923 Winnetka St
- 4928 Old Spanish Trail
- 4918 Culmore Dr
- 4406 Laurel Dr
- 4322 Laurel Dr
- 4405 Charleston St
- 4401 Charleston St
- 4409 Charleston St
- 4401 Laurel Dr
- 4414 Laurel Dr
- 4318 Laurel Dr
- 4319 Charleston St
- 4319 Laurel Dr
- 4409 Laurel Dr
- 4415 Charleston St
- 4315 Laurel Dr
- 4315 Charleston St
- 4418 Laurel Dr
- 4419 Laurel Dr
- 4419 Charleston St
- 4402 Fernwood Dr
- 4406 Fernwood Dr
- 4322 Fernwood Dr