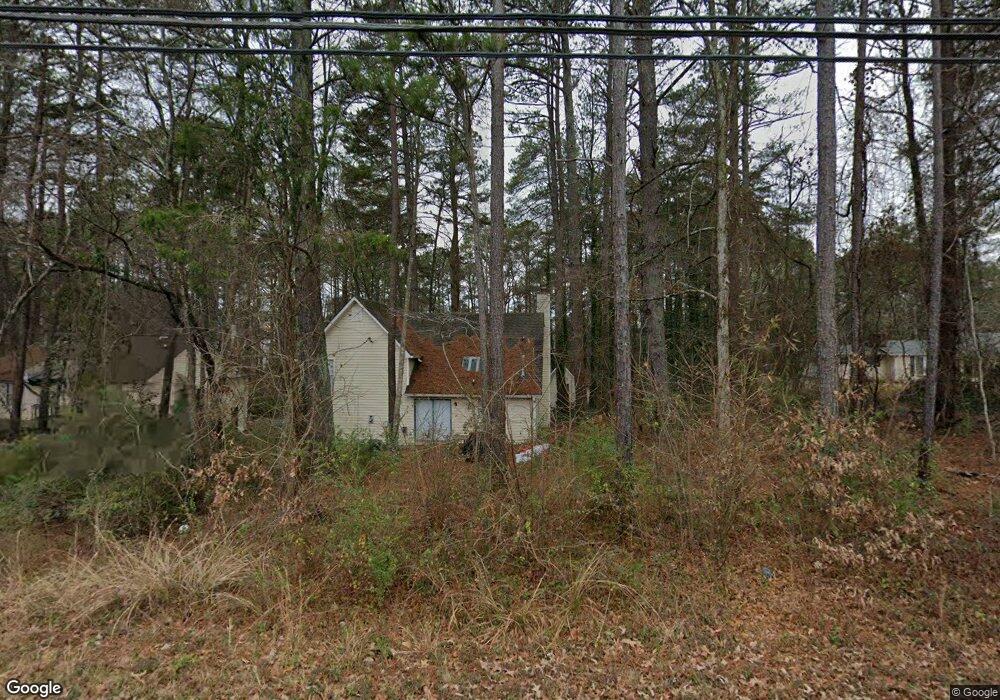
4403 Brandon Ct NE Marietta, GA 30066
Sandy Plains NeighborhoodEstimated Value: $286,000 - $364,000
3
Beds
2
Baths
959
Sq Ft
$334/Sq Ft
Est. Value
About This Home
This home is located at 4403 Brandon Ct NE, Marietta, GA 30066 and is currently estimated at $320,675, approximately $334 per square foot. 4403 Brandon Ct NE is a home located in Cobb County with nearby schools including Rocky Mount Elementary School, Mabry Middle School, and Lassiter High School.
Ownership History
Date
Name
Owned For
Owner Type
Purchase Details
Closed on
Jul 27, 2021
Sold by
Scoobydue Fund 401K
Bought by
Beasley Eunice Teresa and Beasley Patrick Marcel
Current Estimated Value
Home Financials for this Owner
Home Financials are based on the most recent Mortgage that was taken out on this home.
Original Mortgage
$220,000
Outstanding Balance
$199,707
Interest Rate
2.93%
Mortgage Type
Purchase Money Mortgage
Estimated Equity
$120,968
Purchase Details
Closed on
Jan 31, 2020
Sold by
Etc Custodian Fbo
Bought by
Sis Fbo Scoobydue Fund 401K
Purchase Details
Closed on
May 15, 2018
Sold by
Equity Trust Company Custodian Fbo
Bought by
Specialized Ira Svcs Fbo and Scoobydue Fund 401K Plan
Purchase Details
Closed on
Dec 28, 2011
Sold by
Dickerson David C
Bought by
Weise David J
Purchase Details
Closed on
Mar 29, 2004
Sold by
Weise David J
Bought by
Dickerson David C
Create a Home Valuation Report for This Property
The Home Valuation Report is an in-depth analysis detailing your home's value as well as a comparison with similar homes in the area
Home Values in the Area
Average Home Value in this Area
Purchase History
| Date | Buyer | Sale Price | Title Company |
|---|---|---|---|
| Beasley Eunice Teresa | $225,000 | None Available | |
| Sis Fbo Scoobydue Fund 401K | -- | -- | |
| Specialized Ira Svcs Fbo | -- | -- | |
| Weise David J | -- | -- | |
| Dickerson David C | $1,535,000 | -- |
Source: Public Records
Mortgage History
| Date | Status | Borrower | Loan Amount |
|---|---|---|---|
| Open | Beasley Eunice Teresa | $220,000 |
Source: Public Records
Tax History Compared to Growth
Tax History
| Year | Tax Paid | Tax Assessment Tax Assessment Total Assessment is a certain percentage of the fair market value that is determined by local assessors to be the total taxable value of land and additions on the property. | Land | Improvement |
|---|---|---|---|---|
| 2025 | $2,228 | $87,372 | $22,000 | $65,372 |
| 2024 | $2,230 | $87,372 | $22,000 | $65,372 |
| 2023 | $1,687 | $87,372 | $22,000 | $65,372 |
| 2022 | $1,902 | $71,688 | $16,000 | $55,688 |
| 2021 | $2,176 | $71,688 | $16,000 | $55,688 |
| 2020 | $2,176 | $71,688 | $16,000 | $55,688 |
| 2019 | $1,284 | $42,304 | $12,000 | $30,304 |
| 2018 | $1,284 | $42,304 | $12,000 | $30,304 |
| 2017 | $1,106 | $38,472 | $15,580 | $22,892 |
| 2016 | $1,106 | $38,472 | $15,580 | $22,892 |
| 2015 | $1,133 | $38,472 | $15,580 | $22,892 |
| 2014 | $1,309 | $44,072 | $0 | $0 |
Source: Public Records
Map
Nearby Homes
- 2603 Chadwick Rd
- 4499 Browning Ct NE
- 2610 Chadwick Rd
- 2402 Woodbridge Dr
- 4056 Longford Dr NE
- 4050 Idlewilde Meadows Dr NE
- 2124 Lassiter Field Dr NE
- 4509 N Landing Dr
- 4509 N Bay Ct
- 3844 Havenrock
- 3816 Havenrock Dr
- 4709 Trickum Rd NE
- 3812 Havenrock Dr
- 4314 Keheley Lake Ct NE
- 4281 Keheley Lake Dr NE
- 2578 Middle Coray Cir
- 4592 N Landing Dr
- 4181 Keheley Dr NE
- 4401 Brandon Ct NE
- 4291 Trickum Rd NE
- 4405 Brandon Ct NE
- 4280 Trickum Rd NE
- 4389 Brandon Ct NE Unit 2
- 4389 Brandon Ct NE
- 4389 Brandon Ct NE
- 4267 Trickum Rd NE
- 4290 Trickum Rd NE
- 4270 Trickum Rd NE Unit 2
- 4397 Brandon Ct NE
- 4407 Brandon Ct NE
- 4300 Trickum Rd NE
- 4260 Trickum Rd NE
- 3970 Timberbrook Ln Unit 67
- 3970 Timberbrook Ln
- 3966 Timberbrook Ln Unit 1
- 4250 Trickum Rd NE Unit 2
- 4279 Brandon Ridge Dr NE Unit 1
- 4265 Brandon Ridge Dr NE Unit 1