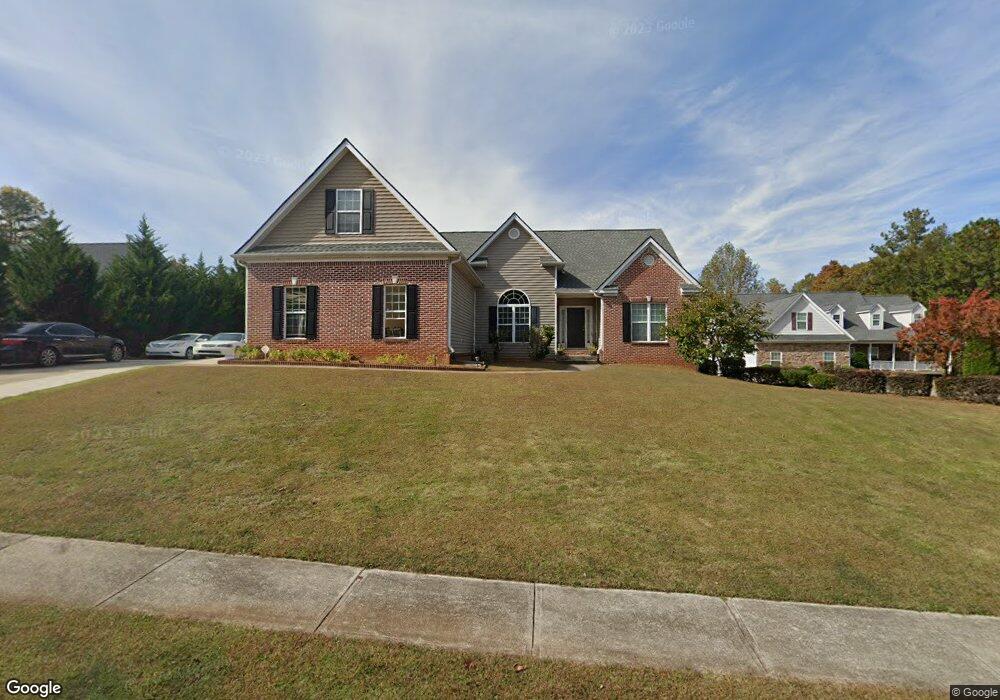
4403 Shag Bark Trail Gainesville, GA 30507
Southeast Gainesville NeighborhoodEstimated Value: $466,504 - $528,000
3
Beds
2
Baths
3,138
Sq Ft
$161/Sq Ft
Est. Value
About This Home
This home is located at 4403 Shag Bark Trail, Gainesville, GA 30507 and is currently estimated at $504,626, approximately $160 per square foot. 4403 Shag Bark Trail is a home located in Hall County with nearby schools including Chestnut Mountain Elementary School, South Hall Middle School, and Johnson High School.
Ownership History
Date
Name
Owned For
Owner Type
Purchase Details
Closed on
Jul 28, 2006
Sold by
Ddr Construction Company Inc
Bought by
Tran Loi Thi and Dinh Hung
Current Estimated Value
Home Financials for this Owner
Home Financials are based on the most recent Mortgage that was taken out on this home.
Original Mortgage
$234,720
Outstanding Balance
$154,982
Interest Rate
8.99%
Mortgage Type
New Conventional
Estimated Equity
$349,644
Purchase Details
Closed on
Aug 9, 2005
Sold by
Walnut River Llc
Bought by
D D R Construction Co Inc
Home Financials for this Owner
Home Financials are based on the most recent Mortgage that was taken out on this home.
Original Mortgage
$191,250
Interest Rate
5.61%
Purchase Details
Closed on
Aug 25, 2003
Sold by
Tilleland Merritt Llc
Bought by
Walnut River Llc
Create a Home Valuation Report for This Property
The Home Valuation Report is an in-depth analysis detailing your home's value as well as a comparison with similar homes in the area
Home Values in the Area
Average Home Value in this Area
Purchase History
| Date | Buyer | Sale Price | Title Company |
|---|---|---|---|
| Tran Loi Thi | $260,800 | -- | |
| D D R Construction Co Inc | $199,500 | -- | |
| Walnut River Llc | $2,971,100 | -- |
Source: Public Records
Mortgage History
| Date | Status | Borrower | Loan Amount |
|---|---|---|---|
| Open | Tran Loi Thi | $234,720 | |
| Previous Owner | D D R Construction Co Inc | $191,250 |
Source: Public Records
Tax History Compared to Growth
Tax History
| Year | Tax Paid | Tax Assessment Tax Assessment Total Assessment is a certain percentage of the fair market value that is determined by local assessors to be the total taxable value of land and additions on the property. | Land | Improvement |
|---|---|---|---|---|
| 2025 | $4,261 | $208,000 | $38,000 | $170,000 |
| 2024 | $4,642 | $182,960 | $31,520 | $151,440 |
| 2023 | $4,016 | $173,280 | $21,960 | $151,320 |
| 2022 | $3,823 | $143,680 | $21,360 | $122,320 |
| 2021 | $3,426 | $125,920 | $19,200 | $106,720 |
| 2020 | $3,362 | $120,000 | $19,200 | $100,800 |
| 2019 | $3,302 | $116,760 | $19,200 | $97,560 |
| 2018 | $3,373 | $115,560 | $22,160 | $93,400 |
| 2017 | $2,849 | $98,120 | $10,480 | $87,640 |
| 2016 | $2,349 | $82,080 | $8,720 | $73,360 |
| 2015 | $1,971 | $67,769 | $8,720 | $59,049 |
| 2014 | $1,971 | $67,769 | $8,720 | $59,049 |
Source: Public Records
Map
Nearby Homes
- 4473 Circassian Place
- 2779 Summer Creek Dr
- 2460 Calvary Church Rd
- 4715 Creek Wood Dr
- 2948 Colony Ct
- 3927 Celtic Ct
- 4609 Hunters Ct
- 5261 Hopewell Ln
- 4135 Ashford Way
- 6064 Cane Crossing Dr
- 4234 Quail Creek Dr
- 4226 Quail Creek Dr
- 6021 Cane Crossing Dr
- 4621 Chartwell Chase Ct
- 4211 Quail Creek Dr
- 5074 Peach Mountain Cir
- 4745 Shady Lake Cir
- 4947 Weaver Rd
- 0 Marble Arch Way
- 4315 Marble Arch Way
- 4397 Shag Bark Trail
- 4407 Shag Bark Trail
- 4411 Shag Bark Trail
- 4411 Shag Bark Trail
- 4402 Shag Bark Trail
- 4391 Shag Bark Trail
- 4410 Shag Bark Trail
- 4394 Shag Bark Trail
- 4390 Shag Bark Trail
- 4385 Shag Bark Trail
- 4384 Shag Bark Trail
- 4379 Shag Bark Trail
- 4378 Shag Bark Trail
- 4485 Circassian Place
- 4489 Circassian Place
- 4481 Circassian Place
- 4473 Circassian Place Unit 47
- 2625 Webb Girth Rd
- 4493 Circassian Place Unit 52
- 4477 Circassian Place