4404 Mt Bullion St Denair, CA 95316
Estimated Value: $621,000 - $685,000
5
Beds
2
Baths
2,532
Sq Ft
$255/Sq Ft
Est. Value
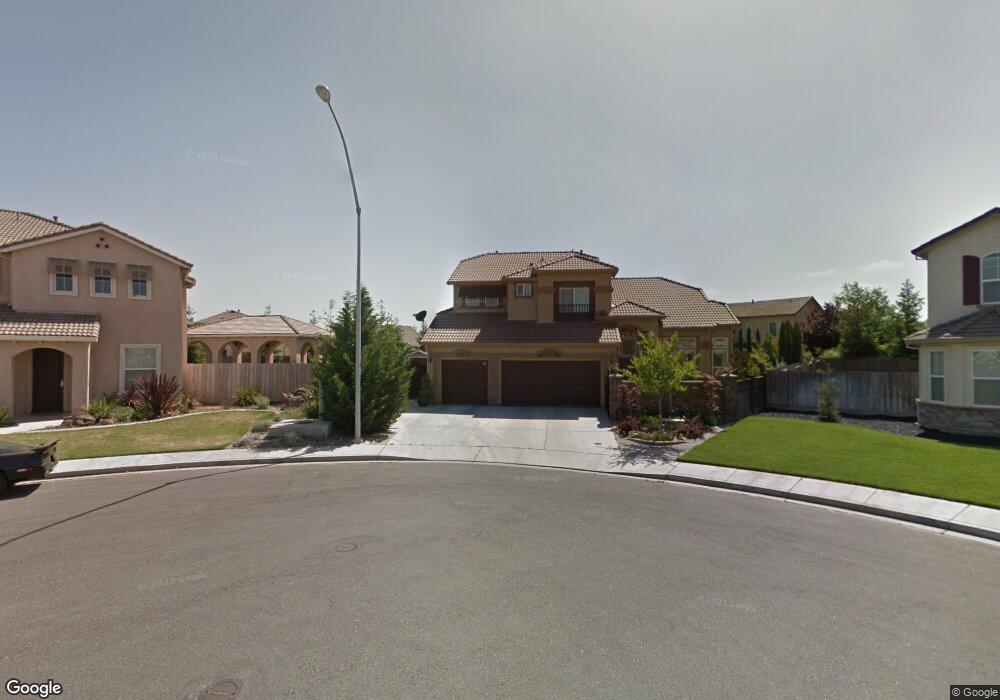
About This Home
This home is located at 4404 Mt Bullion St, Denair, CA 95316 and is currently estimated at $644,533, approximately $254 per square foot. 4404 Mt Bullion St is a home located in Stanislaus County with nearby schools including Denair Elementary School, Denair Middle School, and Denair High School.
Ownership History
Date
Name
Owned For
Owner Type
Purchase Details
Closed on
Sep 17, 2015
Sold by
Wagoner Michael L
Bought by
Wagoner 2015 Revocable Trust
Current Estimated Value
Purchase Details
Closed on
Jan 8, 2008
Sold by
Williford Kevin Michael
Bought by
Wagoner Michael L and Wagoner Patricia R
Home Financials for this Owner
Home Financials are based on the most recent Mortgage that was taken out on this home.
Original Mortgage
$304,000
Outstanding Balance
$189,918
Interest Rate
6.05%
Mortgage Type
Purchase Money Mortgage
Estimated Equity
$454,615
Purchase Details
Closed on
Mar 29, 2006
Sold by
Jkb Homes Norcal Inc
Bought by
Williford Kevin Michael and Williford Melanie
Home Financials for this Owner
Home Financials are based on the most recent Mortgage that was taken out on this home.
Original Mortgage
$382,482
Interest Rate
6.62%
Mortgage Type
Fannie Mae Freddie Mac
Create a Home Valuation Report for This Property
The Home Valuation Report is an in-depth analysis detailing your home's value as well as a comparison with similar homes in the area
Home Values in the Area
Average Home Value in this Area
Purchase History
| Date | Buyer | Sale Price | Title Company |
|---|---|---|---|
| Wagoner 2015 Revocable Trust | -- | None Available | |
| Wagoner Michael L | $380,000 | North American Title Company | |
| Williford Kevin Michael | $478,500 | First American Title Co |
Source: Public Records
Mortgage History
| Date | Status | Borrower | Loan Amount |
|---|---|---|---|
| Open | Wagoner Michael L | $304,000 | |
| Previous Owner | Williford Kevin Michael | $382,482 |
Source: Public Records
Tax History
| Year | Tax Paid | Tax Assessment Tax Assessment Total Assessment is a certain percentage of the fair market value that is determined by local assessors to be the total taxable value of land and additions on the property. | Land | Improvement |
|---|---|---|---|---|
| 2025 | $6,011 | $508,783 | $164,183 | $344,600 |
| 2024 | $5,874 | $498,808 | $160,964 | $337,844 |
| 2023 | $5,704 | $489,028 | $157,808 | $331,220 |
| 2022 | $5,577 | $479,440 | $154,714 | $324,726 |
| 2021 | $5,557 | $470,040 | $151,681 | $318,359 |
| 2020 | $5,506 | $465,221 | $150,126 | $315,095 |
| 2019 | $5,226 | $456,100 | $147,183 | $308,917 |
| 2018 | $5,256 | $447,158 | $144,298 | $302,860 |
| 2017 | $4,571 | $391,500 | $120,000 | $271,500 |
| 2016 | $4,641 | $392,500 | $100,000 | $292,500 |
| 2015 | $4,394 | $383,500 | $75,500 | $308,000 |
| 2014 | $4,143 | $355,000 | $70,000 | $285,000 |
Source: Public Records
Map
Nearby Homes
- 4513 E Tuolumne Rd
- 4615 Navaho Ct
- 2912 Marazan St
- 4115 Valkommen Dr
- 3620 E Monte Vista Ave
- 3416 N Gratton Rd
- 3600 E Hawkeye Ave
- 2970 E Tuolumne Rd
- 1980 Wyndfair Dr
- 3324 Dillion Way
- 3230 Dillion Way
- 3406 Dillion Way
- 3445 Dillion Way
- 3438 Dillion Way
- 3300 Dillion Way
- 3421 Dillion Way
- 3533 Dillion Way
- 3437 Dillion Way
- 3316 Dillion Way
- 3422 Dillion Way
- 4408 Mt Bullion St
- 2414 Deborah Dr
- 2501 Salluce Dr
- 2410 Deborah Dr
- 2418 Deborah Dr
- 4403 E Tuolumne Rd
- 4407 E Tuolumne Rd
- 2406 Deborah Dr
- 4412 Mt Bullion St
- 2505 Salluce Dr
- 4411 E Tuolumne Rd
- 4315 Pimentel Dr
- 2402 Deborah Dr
- 4409 Mt Bullion St
- 4415 E Tuolumne Rd
- 4409 Mount Bullion St
- 4416 Mt Bullion St
- 2509 Salluce Dr
- 2413 Deborah Dr
- 4311 Pimentel Dr
Your Personal Tour Guide
Ask me questions while you tour the home.