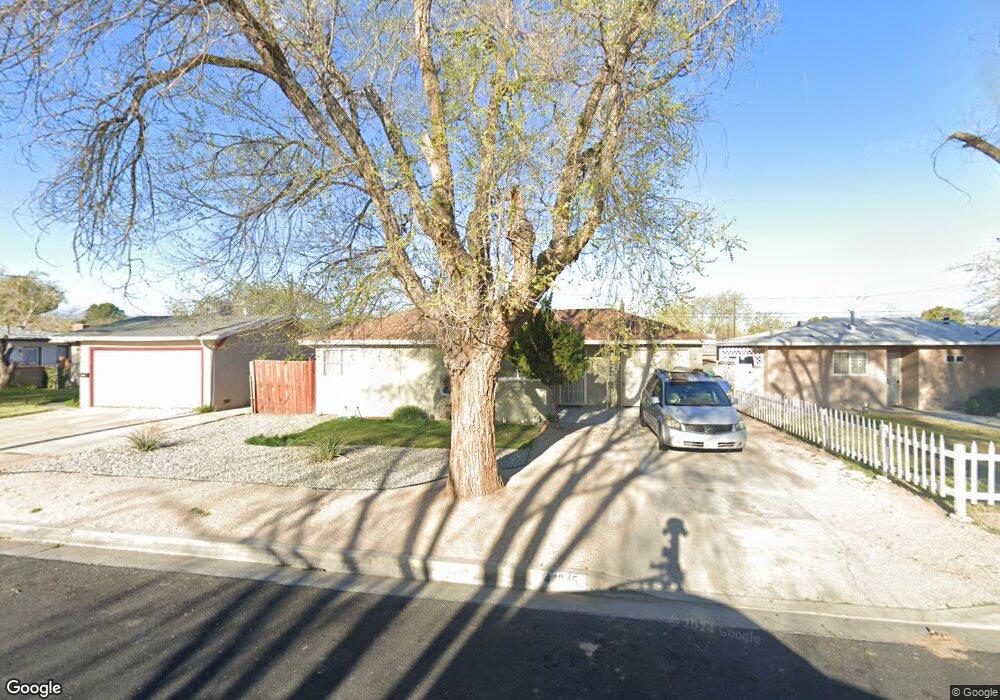
44045 Cedar Ave Lancaster, CA 93534
Central Lancaster NeighborhoodEstimated Value: $337,266 - $417,000
3
Beds
1
Bath
1,126
Sq Ft
$326/Sq Ft
Est. Value
About This Home
This home is located at 44045 Cedar Ave, Lancaster, CA 93534 and is currently estimated at $367,317, approximately $326 per square foot. 44045 Cedar Ave is a home located in Los Angeles County with nearby schools including Sierra Elementary School, Endeavour Middle School, and Antelope Valley High School.
Ownership History
Date
Name
Owned For
Owner Type
Purchase Details
Closed on
Oct 21, 2013
Sold by
Waters Suzan
Bought by
Rosenberg Edward
Current Estimated Value
Purchase Details
Closed on
Apr 30, 2013
Sold by
Waters Suzan
Bought by
Rosenberg Edward
Purchase Details
Closed on
Jun 19, 2009
Sold by
Stafford Carol
Bought by
Waters Suzan
Purchase Details
Closed on
Dec 9, 2008
Sold by
Wachovia Mortgage Fsb
Bought by
Stafford Carol
Purchase Details
Closed on
Nov 14, 2008
Sold by
Lawrence Linda A and Lawrence Kevin
Bought by
Wachovia Mortgage Fsb and World Savings Bank Fsb
Purchase Details
Closed on
Sep 23, 2002
Sold by
Henderson Roc A and Henderson Carrie L
Bought by
Lawrence Kevin
Home Financials for this Owner
Home Financials are based on the most recent Mortgage that was taken out on this home.
Original Mortgage
$80,910
Interest Rate
5.99%
Purchase Details
Closed on
Feb 23, 1994
Sold by
Antelope Valley Trust Deed Services Inc
Bought by
Hodgson Raye
Create a Home Valuation Report for This Property
The Home Valuation Report is an in-depth analysis detailing your home's value as well as a comparison with similar homes in the area
Home Values in the Area
Average Home Value in this Area
Purchase History
| Date | Buyer | Sale Price | Title Company |
|---|---|---|---|
| Rosenberg Edward | -- | None Available | |
| Rosenberg Edward | -- | None Available | |
| Waters Suzan | -- | Accommodation | |
| Stafford Carol | $46,000 | Fidelity National Title Co | |
| Wachovia Mortgage Fsb | $136,940 | None Available | |
| Lawrence Kevin | $90,000 | Fidelity National Title Co | |
| Hodgson Raye | $74,719 | Chicago Title Insurance Co |
Source: Public Records
Mortgage History
| Date | Status | Borrower | Loan Amount |
|---|---|---|---|
| Previous Owner | Lawrence Kevin | $80,910 |
Source: Public Records
Tax History
| Year | Tax Paid | Tax Assessment Tax Assessment Total Assessment is a certain percentage of the fair market value that is determined by local assessors to be the total taxable value of land and additions on the property. | Land | Improvement |
|---|---|---|---|---|
| 2025 | $2,391 | $96,408 | $25,809 | $70,599 |
| 2024 | $2,391 | $94,518 | $25,303 | $69,215 |
| 2023 | $2,450 | $92,665 | $24,807 | $67,858 |
| 2022 | $2,277 | $90,849 | $24,321 | $66,528 |
| 2021 | $1,905 | $89,069 | $23,845 | $65,224 |
| 2019 | $1,860 | $86,430 | $23,139 | $63,291 |
| 2018 | $1,829 | $84,736 | $22,686 | $62,050 |
| 2016 | $1,745 | $81,448 | $21,806 | $59,642 |
| 2015 | $1,727 | $80,226 | $21,479 | $58,747 |
| 2014 | $1,737 | $78,656 | $21,059 | $57,597 |
Source: Public Records
Map
Nearby Homes
- 44036 Cedar Ave
- 44048 Elm Ave
- 44054 Elm Ave
- 428 W Avenue j5 Unit 21
- 433 W Avenue j5 Unit 13
- 521 W Avenue j5
- 538 W Avenue j4
- 552 W Avenue j4
- 517 W Avenue j10
- 44054 Fern Ave
- 44227 Date Ave
- 44108 Gadsden Ave
- 318 W Avenue J-10
- 318 W Avenue j10
- 4 Gadsden Ave
- 0 Gadsden Ave
- 554 W Avenue j11
- 554 W Avenue J-11
- 43848 Fern Ave
- 447 W Avenue j12
- 44051 Cedar Ave
- 44039 Cedar Ave
- 44055 Cedar Ave
- 44035 Cedar Ave
- 44040 Date Ave
- 44034 Date Ave
- 44046 Date Ave
- 44028 Date Ave
- 44050 Date Ave
- 44061 Cedar Ave
- 44029 Cedar Ave
- 44042 Cedar Ave
- 44048 Cedar Ave
- 44024 Date Ave
- 44056 Date Ave
- 44054 Cedar Ave
- 44030 Cedar Ave
- 44065 Cedar Ave
- 44023 Cedar Ave
- 44060 Cedar Ave
Your Personal Tour Guide
Ask me questions while you tour the home.