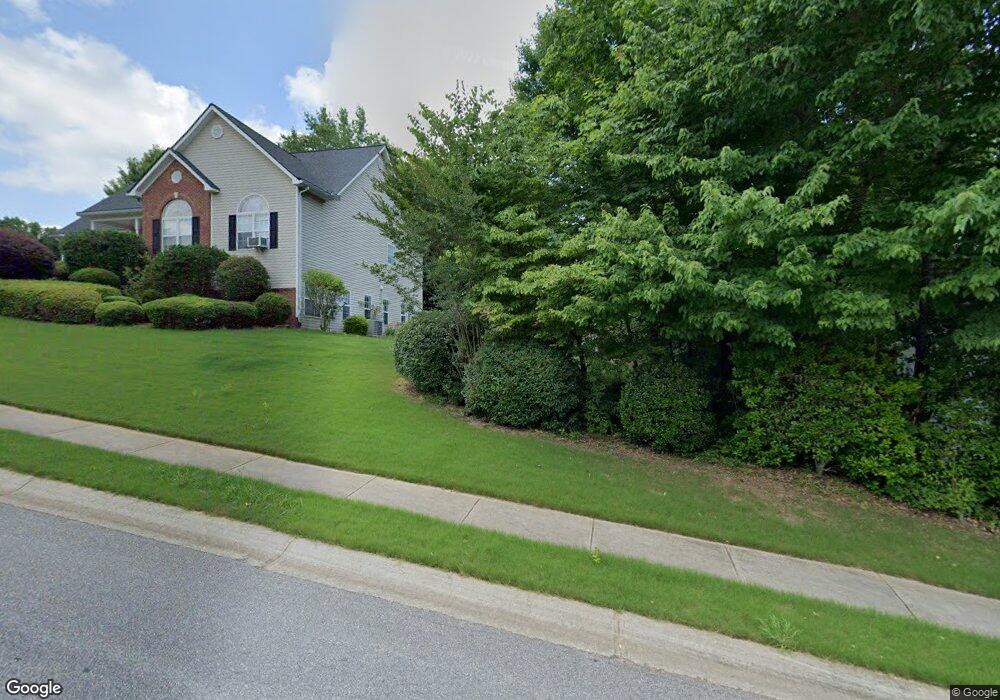
4405 Enfield Dr Unit 1 Gainesville, GA 30506
Estimated Value: $399,948 - $430,000
3
Beds
2
Baths
2,008
Sq Ft
$208/Sq Ft
Est. Value
About This Home
This home is located at 4405 Enfield Dr Unit 1, Gainesville, GA 30506 and is currently estimated at $418,237, approximately $208 per square foot. 4405 Enfield Dr Unit 1 is a home located in Hall County with nearby schools including Lanier Elementary School, Chestatee Middle School, and Chestatee High School.
Ownership History
Date
Name
Owned For
Owner Type
Purchase Details
Closed on
May 31, 2024
Sold by
Sullivan John P
Bought by
Mccormack R Thad Tr
Current Estimated Value
Purchase Details
Closed on
Aug 26, 2013
Sold by
Hammond John E
Bought by
Sullivan John P and Sullivan Freda S
Purchase Details
Closed on
Nov 28, 2005
Sold by
Hudgins Sherry
Bought by
Hammond John E and Hammond Suzanne
Purchase Details
Closed on
Sep 3, 2003
Sold by
Lanier Custom Homes Inc
Bought by
Hudgins Sherry
Home Financials for this Owner
Home Financials are based on the most recent Mortgage that was taken out on this home.
Original Mortgage
$110,000
Interest Rate
6.13%
Mortgage Type
New Conventional
Purchase Details
Closed on
Jan 21, 2003
Sold by
Highway 53 Properties Inc
Bought by
Dc&L Sardis Llc
Create a Home Valuation Report for This Property
The Home Valuation Report is an in-depth analysis detailing your home's value as well as a comparison with similar homes in the area
Home Values in the Area
Average Home Value in this Area
Purchase History
| Date | Buyer | Sale Price | Title Company |
|---|---|---|---|
| Mccormack R Thad Tr | -- | -- | |
| Sullivan John P | $195,000 | -- | |
| Hammond John E | $189,000 | -- | |
| Hudgins Sherry | $167,400 | -- | |
| Dc&L Sardis Llc | $168,000 | -- |
Source: Public Records
Mortgage History
| Date | Status | Borrower | Loan Amount |
|---|---|---|---|
| Previous Owner | Hudgins Sherry | $110,000 |
Source: Public Records
Tax History Compared to Growth
Tax History
| Year | Tax Paid | Tax Assessment Tax Assessment Total Assessment is a certain percentage of the fair market value that is determined by local assessors to be the total taxable value of land and additions on the property. | Land | Improvement |
|---|---|---|---|---|
| 2024 | $1,407 | $156,120 | $26,520 | $129,600 |
| 2023 | $1,435 | $146,720 | $28,640 | $118,080 |
| 2022 | $1,390 | $142,000 | $28,040 | $113,960 |
| 2021 | $1,102 | $103,160 | $12,240 | $90,920 |
| 2020 | $1,072 | $97,680 | $12,240 | $85,440 |
| 2019 | $1,047 | $92,760 | $12,240 | $80,520 |
| 2018 | $1,017 | $87,600 | $10,200 | $77,400 |
| 2017 | $1,802 | $79,360 | $10,200 | $69,160 |
| 2016 | $1,741 | $79,360 | $10,200 | $69,160 |
| 2015 | $1,555 | $73,720 | $8,160 | $65,560 |
| 2014 | $1,555 | $72,160 | $6,600 | $65,560 |
Source: Public Records
Map
Nearby Homes
- 4506 Old Princeton Ridge Unit 1
- 4522 Old Princeton Ridge
- 4606 Enfield Dr
- 4409 Waterman Dr
- 4135 Cha Co Rd
- 4704 Hanson Hills Ct
- 4722 Middleboro Ln
- 4363 Sardis Rd
- 4340 Oak Creek Dr
- 4232 Green Valley Dr
- 4466 Sardis Dr
- 3286 High View Ct
- 3292 High View Ct
- 3834 Covered Bridge Place
- 4051 Hidden Hollow Dr Unit A
- 4033 Hidden Hollow Dr
- 4369 Old Princeton Ridge Unit 47
- 4413 Enfield Dr Unit 1
- 4406 Enfield Dr Unit 1
- 4366 Old Wyndoham Ct
- 4363 Old Princeton Ridge Unit 1
- 4370 Old Wyndoham Ct
- 0 Old Princeton Ridge Unit 2929941
- 0 Old Princeton Ridge Unit 2922942
- 0 Old Princeton Ridge Unit 2922936
- 0 Old Princeton Ridge Unit 8671325
- 0 Old Princeton Ridge Unit 7549485
- 0 Old Princeton Ridge Unit 7068051
- 0 Old Princeton Ridge Unit 9055945
- 0 Old Princeton Ridge Unit 8806179
- 0 Old Princeton Ridge Unit 8884121
- 0 Old Princeton Ridge Unit 8941699
- 0 Old Princeton Ridge Unit 7176144
- 0 Old Princeton Ridge Unit 7216460
- 0 Old Princeton Ridge Unit 7353947
- 0 Old Princeton Ridge Unit 7396401