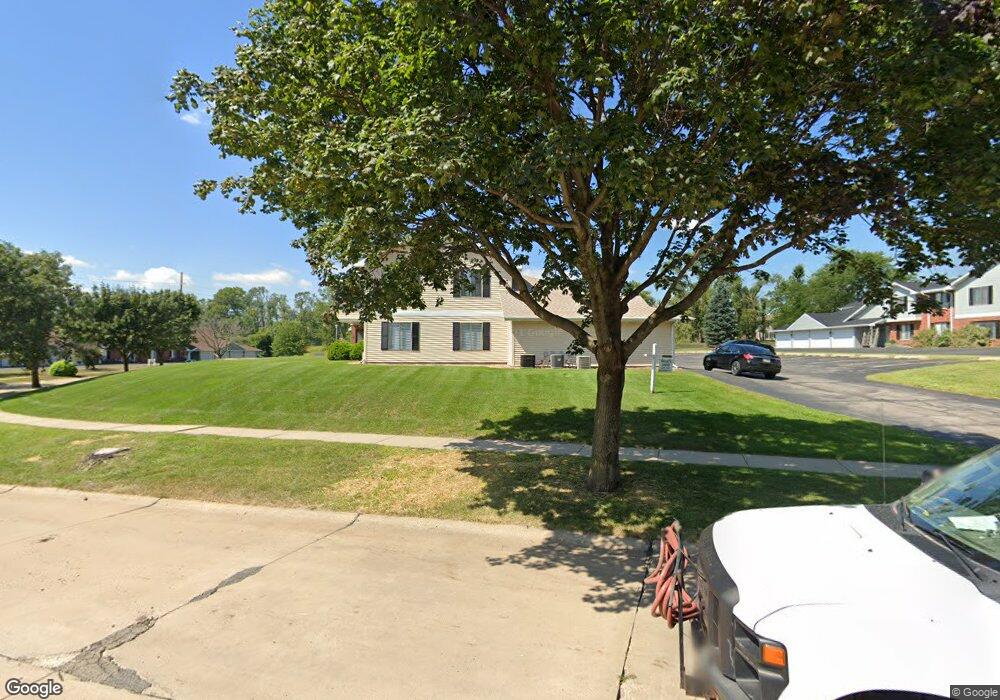
4405 Maureen Ct SE Cedar Rapids, IA 52403
Estimated Value: $130,000 - $140,000
2
Beds
2
Baths
1,153
Sq Ft
$119/Sq Ft
Est. Value
About This Home
This home is located at 4405 Maureen Ct SE, Cedar Rapids, IA 52403 and is currently estimated at $136,640, approximately $118 per square foot. 4405 Maureen Ct SE is a home located in Linn County with nearby schools including Starry Elementary School, Francis Marion Intermediate School, and Vernon Middle School.
Ownership History
Date
Name
Owned For
Owner Type
Purchase Details
Closed on
Sep 11, 2024
Sold by
Freeman Bethany
Bought by
Dema Lauren
Current Estimated Value
Home Financials for this Owner
Home Financials are based on the most recent Mortgage that was taken out on this home.
Original Mortgage
$108,000
Outstanding Balance
$106,581
Interest Rate
6.49%
Mortgage Type
New Conventional
Estimated Equity
$30,059
Purchase Details
Closed on
Aug 25, 2022
Sold by
Gordon Susan J
Bought by
Freeman Bethany
Home Financials for this Owner
Home Financials are based on the most recent Mortgage that was taken out on this home.
Original Mortgage
$13,200
Interest Rate
5.89%
Create a Home Valuation Report for This Property
The Home Valuation Report is an in-depth analysis detailing your home's value as well as a comparison with similar homes in the area
Home Values in the Area
Average Home Value in this Area
Purchase History
| Date | Buyer | Sale Price | Title Company |
|---|---|---|---|
| Dema Lauren | $135,000 | None Listed On Document | |
| Dema Lauren | $135,000 | None Listed On Document | |
| Freeman Bethany | $132,000 | -- |
Source: Public Records
Mortgage History
| Date | Status | Borrower | Loan Amount |
|---|---|---|---|
| Open | Dema Lauren | $108,000 | |
| Closed | Dema Lauren | $108,000 | |
| Previous Owner | Freeman Bethany | $13,200 | |
| Previous Owner | Freeman Bethany | $118,800 |
Source: Public Records
Tax History Compared to Growth
Tax History
| Year | Tax Paid | Tax Assessment Tax Assessment Total Assessment is a certain percentage of the fair market value that is determined by local assessors to be the total taxable value of land and additions on the property. | Land | Improvement |
|---|---|---|---|---|
| 2025 | $2,504 | $129,400 | $19,500 | $109,900 |
| 2024 | $2,356 | $128,000 | $17,000 | $111,000 |
| 2023 | $2,356 | $128,000 | $17,000 | $111,000 |
| 2022 | $1,908 | $111,700 | $17,000 | $94,700 |
| 2021 | $1,986 | $93,800 | $12,000 | $81,800 |
| 2020 | $1,986 | $92,900 | $12,000 | $80,900 |
| 2019 | $1,696 | $81,600 | $12,000 | $69,600 |
| 2018 | $1,648 | $81,600 | $12,000 | $69,600 |
| 2017 | $1,722 | $82,500 | $7,000 | $75,500 |
| 2016 | $1,901 | $82,500 | $7,000 | $75,500 |
| 2015 | $1,937 | $87,306 | $7,000 | $80,306 |
| 2014 | $1,736 | $87,306 | $7,000 | $80,306 |
| 2013 | $1,680 | $87,306 | $7,000 | $80,306 |
Source: Public Records
Map
Nearby Homes
- 4300 Maureen Ct SE Unit 168
- 4410 Maureen Ct SE Unit 189
- 4505 Armar Dr SE Unit 79
- 849 Kerry Ln SE Unit 58
- 869 Kerry Ln SE Unit 46
- 4571 Maureen Dr SE Unit 43
- 4551 Maureen Dr SE Unit 33
- 955 Bridgit Ln SE
- 1005 Bridgit Ct SE Unit 7
- 6030 Northridge Point SE
- 1013 Blairs Ferry R
- 905 Knollcrest Dr
- 1110 Longview Dr
- 735 Carroll Dr SE
- 3140 Carroll Dr SE
- 825 Fairview Dr
- 310 & 320 4th St
- 3111 Carroll Dr SE
- 115 Dawley St NE
- 585 5th Ave
- 4415 Maureen Ct SE
- 4405 Maureen Ct SE Unit 149
- 4415 Maureen Ct SE
- 4415 Maureen Ct SE Unit 147
- 4405 Maureen Ct SE Unit 146
- 4405 Maureen Ct SE
- 4415 Maureen Ct SE
- 4405 Maureen Ct SE Unit 150
- 4415 Maureen Ct SE Unit 152
- 4405 Maureen Ct SE Unit 145
- 4415 Maureen Ct SE Unit 148
- 4415 Maureen Ct SE Unit 151
- 4405 Maureen Ct Se #149 Unit 149
- 859 Edward Ct SE
- 859 Edward Ct SE
- 859 Edward Ct SE Unit 12
- 859 Edward Ct SE Unit 127
- 859 Edward Ct SE Unit 124
- 859 Edward Ct SE Unit 128
- 849 Edward Ct SE