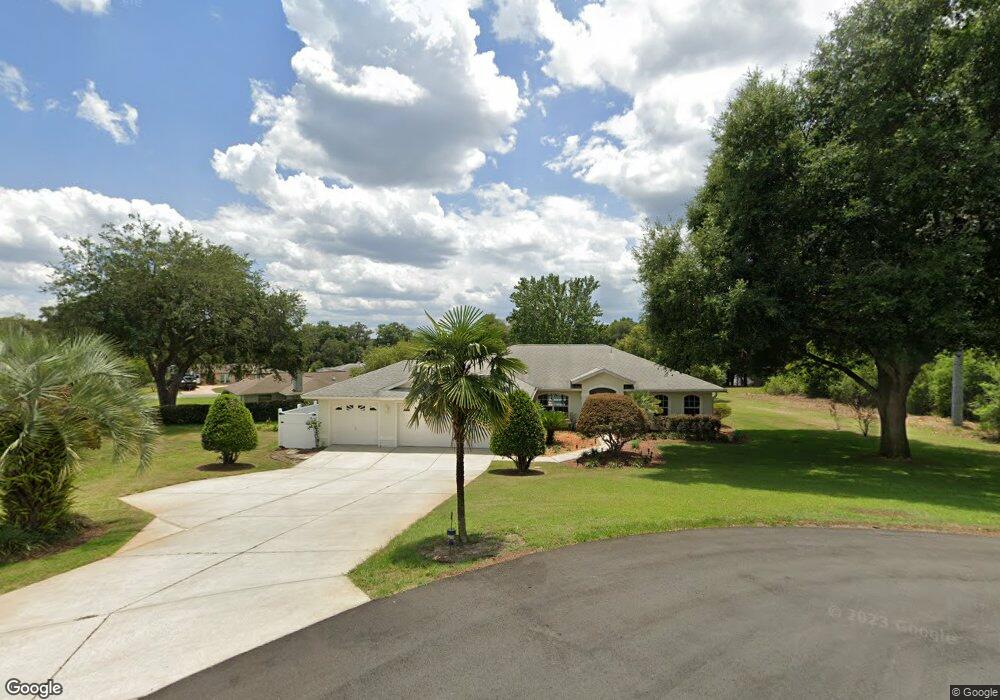
4406 E Eagles Nest Ct Inverness, FL 34453
Estimated Value: $356,950 - $422,000
3
Beds
2
Baths
1,773
Sq Ft
$221/Sq Ft
Est. Value
About This Home
This home is located at 4406 E Eagles Nest Ct, Inverness, FL 34453 and is currently estimated at $390,988, approximately $220 per square foot. 4406 E Eagles Nest Ct is a home located in Citrus County with nearby schools including Hernando Elementary School, Inverness Middle School, and Citrus High School.
Ownership History
Date
Name
Owned For
Owner Type
Purchase Details
Closed on
Sep 29, 2017
Sold by
Neill Arthur M and Krone Neill Nancy C
Bought by
Neill Arthur M and Krone Neill Nancy C
Current Estimated Value
Purchase Details
Closed on
May 26, 2007
Sold by
Carpenter Stanley J and Carpenter Julie K
Bought by
Neill Arthur M and Krone Neill Nancy C
Home Financials for this Owner
Home Financials are based on the most recent Mortgage that was taken out on this home.
Original Mortgage
$61,000
Interest Rate
6.16%
Mortgage Type
Purchase Money Mortgage
Purchase Details
Closed on
Aug 6, 2001
Sold by
Forney Leland and Forney Janet
Bought by
Carpenter Stanley J and Carpenter Julie K
Purchase Details
Closed on
Dec 1, 1998
Bought by
Neill Arthur M and Krone Nancy C
Purchase Details
Closed on
Dec 1, 1985
Bought by
Neill Arthur M and Krone Nancy C
Create a Home Valuation Report for This Property
The Home Valuation Report is an in-depth analysis detailing your home's value as well as a comparison with similar homes in the area
Home Values in the Area
Average Home Value in this Area
Purchase History
| Date | Buyer | Sale Price | Title Company |
|---|---|---|---|
| Neill Arthur M | -- | Attorney | |
| Neill Arthur M | $251,500 | American Title Services Of C | |
| Carpenter Stanley J | $12,000 | American Title Services Of C | |
| Neill Arthur M | $8,000 | -- | |
| Neill Arthur M | $13,900 | -- |
Source: Public Records
Mortgage History
| Date | Status | Borrower | Loan Amount |
|---|---|---|---|
| Closed | Neill Arthur M | $61,000 |
Source: Public Records
Tax History
| Year | Tax Paid | Tax Assessment Tax Assessment Total Assessment is a certain percentage of the fair market value that is determined by local assessors to be the total taxable value of land and additions on the property. | Land | Improvement |
|---|---|---|---|---|
| 2025 | $1,887 | $166,819 | -- | -- |
| 2024 | $1,834 | $162,118 | -- | -- |
| 2023 | $1,834 | $157,396 | $0 | $0 |
| 2022 | $1,779 | $152,812 | $0 | $0 |
| 2021 | $1,706 | $148,361 | $0 | $0 |
| 2020 | $1,645 | $184,065 | $14,500 | $169,565 |
| 2019 | $1,621 | $172,023 | $14,500 | $157,523 |
| 2018 | $1,593 | $151,642 | $14,500 | $137,142 |
| 2017 | $1,585 | $137,469 | $30,090 | $107,379 |
| 2016 | $1,601 | $134,642 | $30,090 | $104,552 |
| 2015 | $1,623 | $133,706 | $30,090 | $103,616 |
| 2014 | $1,778 | $139,860 | $30,316 | $109,544 |
Source: Public Records
Map
Nearby Homes
- 1125 N Sabal Palm Way
- 1271 N Arkansas Terrace
- 4279 E Texas Ln
- 937 N Rembrandt Way Unit 101
- 1051 N Paul Dr
- 891 N Rembrandt Way
- 1040 N Christy Way
- 1313 N Paul Dr
- 4405 E Windmill Dr
- 4631 E Windmill Dr
- 4450 E Windmill Dr Unit 101
- 4450 E Windmill Dr Unit 201
- 1573 N Arkansas Terrace
- 4482 E Avocet Ct
- 1422 N Reed Terrace
- 4301 E Tennessee Ln
- 1329 N Foxrun Terrace
- 4457 E Avocet Ct
- 1438 N Foxrun Terrace
- 4284 E Alabama Ln
- 1046 N Sabal Palm Way
- 1024 N Sabal Palm Way
- 4413 E Eagles Nest Ct
- 1062 N Sabal Palm Way
- 4446 E Eagles Nest Ct
- 0 E Eagles Nest Ct
- 1078 N Sabal Palm Way
- 4441 E Eagles Nest Ct
- 1045 N Sabal Palm Way
- 1063 N Sabal Palm Way
- 4480 E Eagles Nest Ct
- 1077 N Sabal Palm Way
- 1194 N Timucuan Trail
- 4475 E Eagles Nest Ct
- 1142 N Timucuan Trail
- 4363 E Goodwin Ct
- 1097 N Sabal Palm Way
- 4344 E Kelley Ct
Your Personal Tour Guide
Ask me questions while you tour the home.