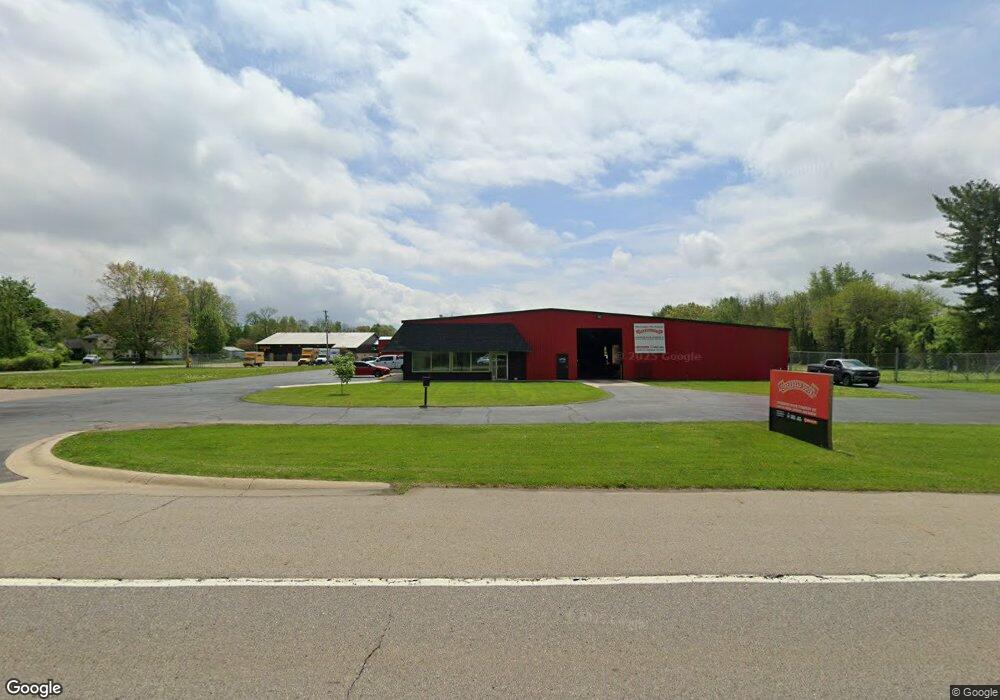
4407 Columbia Ave W Battle Creek, MI 49015
Rural Southwest Battle Creek NeighborhoodEstimated Value: $1,202,063
--
Bed
2
Baths
30,342
Sq Ft
$40/Sq Ft
Est. Value
About This Home
This home is located at 4407 Columbia Ave W, Battle Creek, MI 49015 and is currently estimated at $1,202,063, approximately $39 per square foot. 4407 Columbia Ave W is a home located in Calhoun County with nearby schools including Valley View Elementary School, Springfield Middle School, and Battle Creek Central High School.
Ownership History
Date
Name
Owned For
Owner Type
Purchase Details
Closed on
Jul 1, 2021
Sold by
Visual Resources Llc
Bought by
4407 West Columbia Llc
Current Estimated Value
Purchase Details
Closed on
Nov 10, 2015
Sold by
Quality Truck Service Inc
Bought by
Visual Resources Llc
Purchase Details
Closed on
Nov 11, 2004
Sold by
Quality Truck Service Inc
Bought by
The Bylenga Family Lp
Home Financials for this Owner
Home Financials are based on the most recent Mortgage that was taken out on this home.
Original Mortgage
$350,000
Interest Rate
6.5%
Mortgage Type
Seller Take Back
Purchase Details
Closed on
Nov 10, 2004
Sold by
Lussier Clair R and Lussier Bettina H
Bought by
Quality Truck Service Inc and Battle Creek Truck Service
Home Financials for this Owner
Home Financials are based on the most recent Mortgage that was taken out on this home.
Original Mortgage
$350,000
Interest Rate
6.5%
Mortgage Type
Seller Take Back
Purchase Details
Closed on
Dec 10, 1998
Bought by
Lichty
Create a Home Valuation Report for This Property
The Home Valuation Report is an in-depth analysis detailing your home's value as well as a comparison with similar homes in the area
Home Values in the Area
Average Home Value in this Area
Purchase History
| Date | Buyer | Sale Price | Title Company |
|---|---|---|---|
| 4407 West Columbia Llc | -- | Sun Title Agency Of Mi Llc | |
| Visual Resources Llc | $605,000 | Chicago Title | |
| The Bylenga Family Lp | -- | -- | |
| Quality Truck Service Inc | -- | -- | |
| Lichty | $1,000 | -- |
Source: Public Records
Mortgage History
| Date | Status | Borrower | Loan Amount |
|---|---|---|---|
| Previous Owner | The Bylenga Family Lp | $350,000 |
Source: Public Records
Tax History Compared to Growth
Tax History
| Year | Tax Paid | Tax Assessment Tax Assessment Total Assessment is a certain percentage of the fair market value that is determined by local assessors to be the total taxable value of land and additions on the property. | Land | Improvement |
|---|---|---|---|---|
| 2025 | -- | $416,100 | $0 | $0 |
| 2024 | $19,254 | $411,298 | $0 | $0 |
| 2023 | $24,500 | $407,763 | $0 | $0 |
| 2022 | $17,404 | $370,518 | $0 | $0 |
| 2021 | $16,521 | $360,058 | $0 | $0 |
| 2020 | $16,336 | $366,291 | $0 | $0 |
| 2019 | $15,689 | $357,734 | $0 | $0 |
| 2018 | $15,689 | $313,638 | $28,800 | $284,838 |
| 2017 | $15,283 | $264,380 | $0 | $0 |
| 2016 | $15,028 | $233,553 | $0 | $0 |
| 2015 | $14,330 | $222,988 | $0 | $0 |
| 2014 | $14,330 | $222,988 | $0 | $0 |
Source: Public Records
Map
Nearby Homes
- 263 Cedar Creek Dr Unit 14
- Lot#8 Cedar Creek Dr Unit 254
- 162 Stonegate Ct
- 170 Stonegate Ct
- 309 Waldon Dr
- 305 Waldon Dr
- 303 Waldon Dr
- 156 Stonegate Ct
- Lot#7 Ridgeview Dr
- 209 Ridgeview
- 176 Stonegate Ct
- 315 Waldon Dr
- 155 Stonegate Ct
- 163 Stonegate Ct
- 331 Waldon Dr
- 124 Stonegate Dr
- 119 Stonegate Dr
- 106 Stonegate Dr
- 101 Stonegate Dr
- 100 Stonegate Dr
- 4421 W Columbia Ave
- 140 Newtown Ave
- 4353 Songbird Ln
- 4347 Songbird Ln
- 4341 Songbird Ln
- 4343 W Columbia Ave
- 145 Newtown Ave
- 4335 Songbird Ln
- 160 Newtown Ave
- 159 Newtown Ave
- 161 Newtown Ave
- 14600 Renton Rd
- 14550 Renton Rd
- 169 Newtown Ave
- 178 Newtown Ave
- 4503 Columbia Ave W
- 177 Newtown Ave
- 184 Newtown Ave
- 185 Newtown Ave
- 14578 Renton Rd