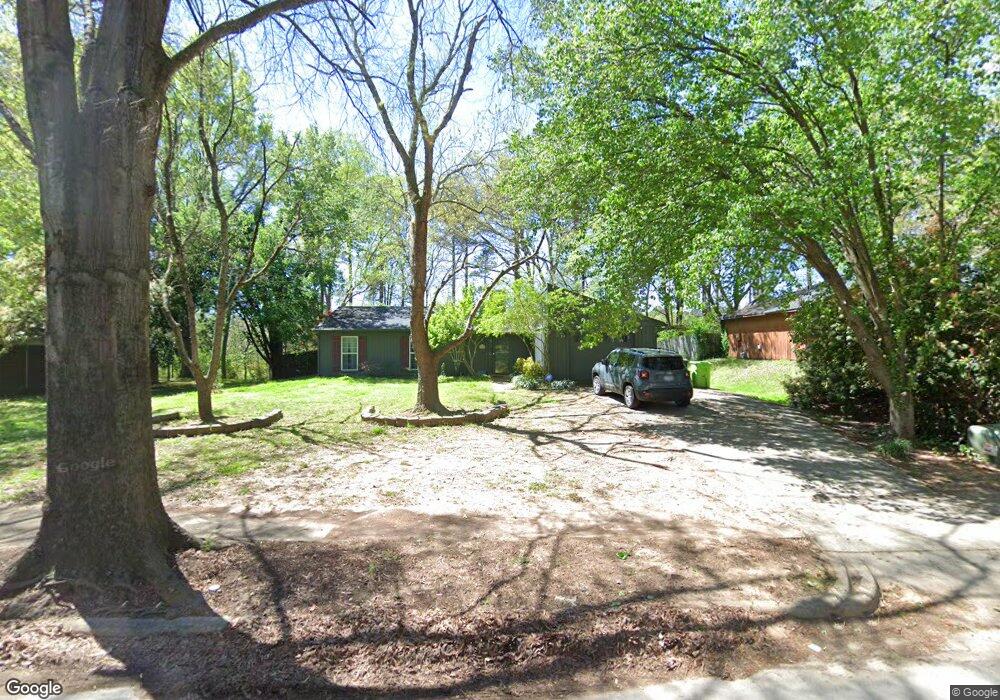
4409 Fox Rd Raleigh, NC 27616
Triangle Town Center NeighborhoodEstimated Value: $323,000 - $334,963
3
Beds
2
Baths
1,472
Sq Ft
$223/Sq Ft
Est. Value
About This Home
This home is located at 4409 Fox Rd, Raleigh, NC 27616 and is currently estimated at $328,741, approximately $223 per square foot. 4409 Fox Rd is a home located in Wake County with nearby schools including River Bend Elementary, River Bend Middle, and Rolesville High School.
Ownership History
Date
Name
Owned For
Owner Type
Purchase Details
Closed on
Feb 5, 2020
Sold by
Clamage Robert A
Bought by
Callahan Tarrah
Current Estimated Value
Home Financials for this Owner
Home Financials are based on the most recent Mortgage that was taken out on this home.
Original Mortgage
$231,830
Interest Rate
3.4%
Mortgage Type
New Conventional
Purchase Details
Closed on
Mar 17, 2017
Sold by
Gore Jackie Hamilton and Miller Mary
Bought by
Clamage Robert A
Home Financials for this Owner
Home Financials are based on the most recent Mortgage that was taken out on this home.
Original Mortgage
$154,156
Interest Rate
4.19%
Mortgage Type
FHA
Purchase Details
Closed on
Apr 21, 2005
Sold by
Horton Wesley Warren and Goodwin Horton Peggy
Bought by
Gore Jackie Hamilton
Home Financials for this Owner
Home Financials are based on the most recent Mortgage that was taken out on this home.
Original Mortgage
$108,000
Interest Rate
5.98%
Mortgage Type
New Conventional
Create a Home Valuation Report for This Property
The Home Valuation Report is an in-depth analysis detailing your home's value as well as a comparison with similar homes in the area
Home Values in the Area
Average Home Value in this Area
Purchase History
| Date | Buyer | Sale Price | Title Company |
|---|---|---|---|
| Callahan Tarrah | $239,000 | None Available | |
| Clamage Robert A | $157,000 | None Available | |
| Gore Jackie Hamilton | $135,000 | -- |
Source: Public Records
Mortgage History
| Date | Status | Borrower | Loan Amount |
|---|---|---|---|
| Previous Owner | Callahan Tarrah | $231,830 | |
| Previous Owner | Clamage Robert A | $154,156 | |
| Previous Owner | Gore Jackie Hamilton | $108,000 |
Source: Public Records
Tax History Compared to Growth
Tax History
| Year | Tax Paid | Tax Assessment Tax Assessment Total Assessment is a certain percentage of the fair market value that is determined by local assessors to be the total taxable value of land and additions on the property. | Land | Improvement |
|---|---|---|---|---|
| 2025 | $2,898 | $330,012 | $110,000 | $220,012 |
| 2024 | $2,886 | $330,012 | $110,000 | $220,012 |
| 2023 | $1,942 | $176,361 | $56,000 | $120,361 |
| 2022 | $1,806 | $176,361 | $56,000 | $120,361 |
| 2021 | $1,736 | $176,361 | $56,000 | $120,361 |
| 2020 | $1,705 | $176,361 | $56,000 | $120,361 |
| 2019 | $1,695 | $144,549 | $38,000 | $106,549 |
| 2018 | $1,599 | $144,549 | $38,000 | $106,549 |
| 2017 | $1,524 | $144,549 | $38,000 | $106,549 |
| 2016 | $1,493 | $144,549 | $38,000 | $106,549 |
| 2015 | $1,455 | $138,549 | $38,000 | $100,549 |
| 2014 | $1,380 | $138,549 | $38,000 | $100,549 |
Source: Public Records
Map
Nearby Homes
- 4625 Fox Rd
- 5320 Spring Pines Way
- 4429 Log Cabin Dr
- 4604 Lavista Ct Unit A & B
- 4505 Woodlawn Dr
- 5000 Mocha Ln
- 4425 Woodlawn Dr
- 4804 Spring Forest Rd
- 5200 Fieldwood Ct
- 4721 Mocha Ln
- 5604 Leonard Mill Rd
- 4317 Woodlawn Dr
- 5325 Marthonna Way
- 4217 James Rd
- 4508 Centrebrook Cir
- 4208 Reddington Trail
- 5708 Sea Fox Ct
- 4800 Arbor Lodge Dr
- 4907 Hollenden Dr Unit 106
- 4809 Kaycee Ct
- 4413 Fox Rd
- 4405 Fox Rd
- 4501 Fox Rd
- 4401 Fox Rd
- 5200 Round Hill Ln
- 4404 Fox Rd
- 4505 Fox Rd
- 4400 Fox Rd
- 5204 Round Hill Ln
- 5201 Round Hill Ln
- 5205 Louisburg Rd
- 4509 Fox Rd
- 5205 Round Hill Ln
- 5208 Round Hill Ln
- 4504 Fox Rd
- 4513 Fox Rd
- 5209 Louisburg Rd
- 5209 Round Hill Ln
- 5212 Round Hill Ln
- 4517 Fox Rd