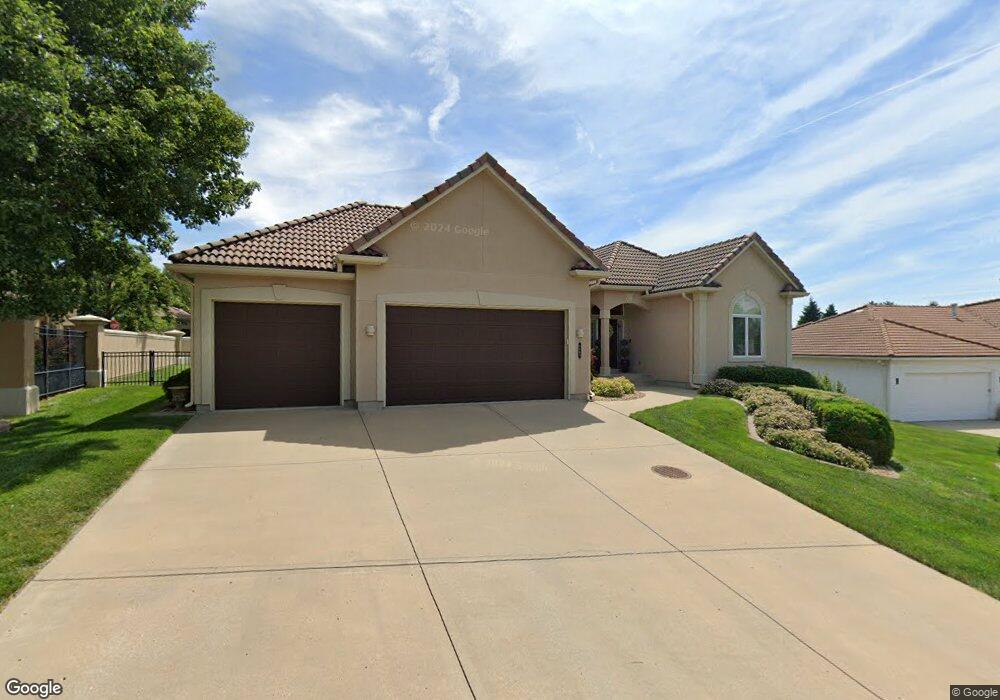
4409 NE de La Mar Cir Lees Summit, MO 64064
Chapel Ridge NeighborhoodEstimated Value: $535,000 - $597,938
3
Beds
4
Baths
1,830
Sq Ft
$307/Sq Ft
Est. Value
About This Home
This home is located at 4409 NE de La Mar Cir, Lees Summit, MO 64064 and is currently estimated at $561,979, approximately $307 per square foot. 4409 NE de La Mar Cir is a home located in Jackson County with nearby schools including Chapel Lakes Elementary School, Delta Woods Middle School, and Blue Springs South High School.
Ownership History
Date
Name
Owned For
Owner Type
Purchase Details
Closed on
Jul 27, 2007
Sold by
Ainsworth Mary
Bought by
Johnson Michael D and Johnson Barbara J
Current Estimated Value
Purchase Details
Closed on
Nov 18, 2006
Sold by
Ainsworth Bruce
Bought by
Ainsworth Mary
Create a Home Valuation Report for This Property
The Home Valuation Report is an in-depth analysis detailing your home's value as well as a comparison with similar homes in the area
Home Values in the Area
Average Home Value in this Area
Purchase History
| Date | Buyer | Sale Price | Title Company |
|---|---|---|---|
| Johnson Michael D | -- | Alpha Title Llc | |
| Ainsworth Mary | -- | None Available |
Source: Public Records
Tax History Compared to Growth
Tax History
| Year | Tax Paid | Tax Assessment Tax Assessment Total Assessment is a certain percentage of the fair market value that is determined by local assessors to be the total taxable value of land and additions on the property. | Land | Improvement |
|---|---|---|---|---|
| 2025 | $6,478 | $90,319 | $10,834 | $79,485 |
| 2024 | $6,361 | $84,588 | $8,892 | $75,696 |
| 2023 | $6,361 | $84,588 | $11,514 | $73,074 |
| 2022 | $7,519 | $88,540 | $9,329 | $79,211 |
| 2021 | $7,512 | $88,540 | $9,329 | $79,211 |
| 2020 | $7,234 | $84,327 | $9,329 | $74,998 |
| 2019 | $7,012 | $84,327 | $9,329 | $74,998 |
| 2018 | $6,635 | $77,396 | $9,145 | $68,251 |
| 2017 | $6,511 | $77,396 | $9,145 | $68,251 |
| 2016 | $6,511 | $76,209 | $11,438 | $64,771 |
| 2014 | $6,296 | $73,226 | $10,698 | $62,528 |
Source: Public Records
Map
Nearby Homes
- 4517 NE Fairway Homes Dr
- 637 NE Shoreline Dr
- 708 NE Lake Pointe Dr
- 917 NE Kenwood Dr
- 712 NE Ashmont Place
- 4524 NE Kingston Dr
- 4600 NE Kingston Dr
- 1108 NE Goshen Ct
- 824 NE Algonquin St Unit A
- 793 NE Algonquin St Unit A
- 4412 NE Gateway Dr
- 801 NE Fairway Homes Ct
- 4605 NE Dick Howser Cir
- 4015 NE Sagamore Dr
- 1317 NE Kenwood Dr
- 801 NE Lone Hill Dr
- 1305 NE Goshen Dr
- 327 NE Landings Dr
- 4004 NE Independence Ave
- 214 NE Landings Cir
- 4401 NE de La Mar Cir
- 4400 NE de La Mar Cir
- 4404 NE de La Mar Cir
- 4408 NE de La Mar Cir
- 4501 NE de La Mar Ct
- 4412 NE de La Mar Cir
- 4500 NE de La Mar Ct
- 4501 NE Fairway Homes Dr
- 820 NE Del Lago Ct
- 816 NE Del Lago Ct
- 4505 NE Fairway Homes Dr
- 717 NE de La Mar Dr
- 4505 NE de La Mar Ct
- 4504 NE de La Mar Ct
- 4503 NE de La Mar Place
- 4508 NE de La Mar Ct
- 4507 NE de La Mar Place
- 713 NE de La Mar Dr
- 812 NE Del Lago Ct
- 4509 NE de La Mar Ct