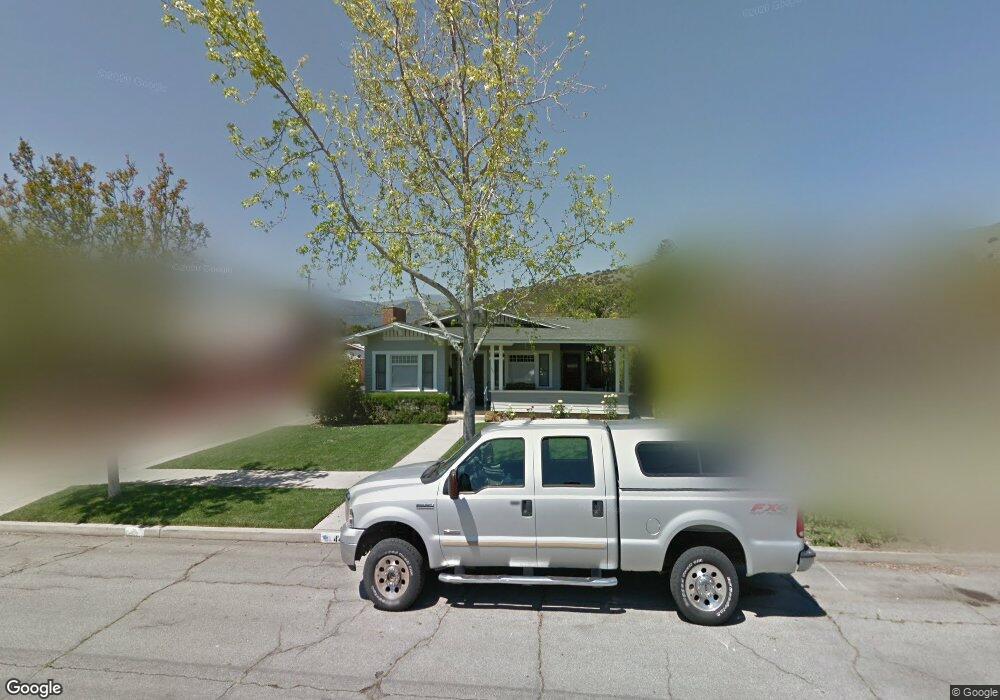
441 3rd St Fillmore, CA 93015
Estimated Value: $571,688 - $602,000
2
Beds
1
Bath
1,397
Sq Ft
$420/Sq Ft
Est. Value
About This Home
This home is located at 441 3rd St, Fillmore, CA 93015 and is currently estimated at $586,922, approximately $420 per square foot. 441 3rd St is a home located in Ventura County with nearby schools including San Cayetano Elementary School and Fillmore Senior High.
Ownership History
Date
Name
Owned For
Owner Type
Purchase Details
Closed on
Jun 12, 2024
Sold by
Seigler Family 2013 Revocable Trust and Seigler Richard Alan
Bought by
Seigler Richard Alan and Seigler Mary Ann
Current Estimated Value
Purchase Details
Closed on
Mar 25, 2015
Sold by
Cruz Noe and Cruz Luisa A
Bought by
Cruz Luisa A
Purchase Details
Closed on
Aug 2, 2013
Sold by
Seigler Jacob J and Seigler Wanda L
Bought by
The Seigler Family 2013 Revocable Trust
Create a Home Valuation Report for This Property
The Home Valuation Report is an in-depth analysis detailing your home's value as well as a comparison with similar homes in the area
Home Values in the Area
Average Home Value in this Area
Purchase History
| Date | Buyer | Sale Price | Title Company |
|---|---|---|---|
| Seigler Richard Alan | -- | None Listed On Document | |
| Cruz Luisa A | -- | None Available | |
| The Seigler Family 2013 Revocable Trust | -- | None Available |
Source: Public Records
Tax History
| Year | Tax Paid | Tax Assessment Tax Assessment Total Assessment is a certain percentage of the fair market value that is determined by local assessors to be the total taxable value of land and additions on the property. | Land | Improvement |
|---|---|---|---|---|
| 2025 | $812 | $74,987 | $17,509 | $57,478 |
| 2024 | $812 | $73,517 | $17,166 | $56,351 |
| 2023 | $801 | $72,076 | $16,829 | $55,247 |
| 2022 | $742 | $70,663 | $16,499 | $54,164 |
| 2021 | $834 | $69,278 | $16,176 | $53,102 |
| 2020 | $776 | $68,569 | $16,011 | $52,558 |
| 2019 | $777 | $67,226 | $15,698 | $51,528 |
| 2018 | $761 | $65,909 | $15,391 | $50,518 |
| 2017 | $764 | $64,618 | $15,090 | $49,528 |
| 2016 | $710 | $63,352 | $14,795 | $48,557 |
| 2015 | $689 | $62,403 | $14,574 | $47,829 |
| 2014 | $688 | $61,183 | $14,290 | $46,893 |
Source: Public Records
Map
Nearby Homes
- 345 Blaine Ave
- 639 Mountain View St
- 809 Woodgrove Rd
- 815 Woodgrove Rd
- 318 Bard St
- 616 Island View St
- 404 Central Ave
- 340 Central Ave
- 831 Blaine Ave
- 949 Blaine Ave
- 158 Arborwood St
- 252 Driftwood St
- 199 Rosewood St
- 81 Wildwood Ln
- 578 Apricot Ln
- 458 Edgewood Dr
- 513 Heritage Valley Pkwy
- 549 Heritage Valley Pkwy
- 600 C St
- 309 Heritage Valley Pkwy
Your Personal Tour Guide
Ask me questions while you tour the home.