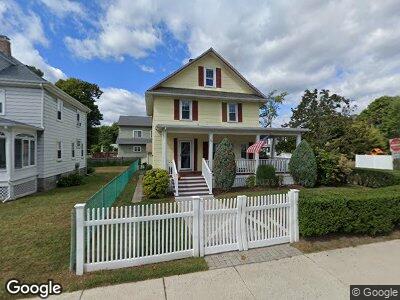
441 Beale St Milton, MA 02186
Estimated Value: $683,000 - $870,000
3
Beds
1
Bath
1,570
Sq Ft
$498/Sq Ft
Est. Value
About This Home
This home is located at 441 Beale St, Milton, MA 02186 and is currently estimated at $782,171, approximately $498 per square foot. 441 Beale St is a home located in Norfolk County with nearby schools including Milton High School, St. Agatha School, and Adams Montessori School.
Ownership History
Date
Name
Owned For
Owner Type
Purchase Details
Closed on
Mar 24, 2006
Sold by
Caraeff Karen A and Mills Karen A
Bought by
Harrington Patrick
Current Estimated Value
Home Financials for this Owner
Home Financials are based on the most recent Mortgage that was taken out on this home.
Original Mortgage
$350,000
Interest Rate
6.28%
Mortgage Type
Purchase Money Mortgage
Purchase Details
Closed on
Aug 18, 1999
Sold by
Mills Warren R and Mills Claire
Bought by
Caraeff Mcihael R and Caraeff Karen A
Home Financials for this Owner
Home Financials are based on the most recent Mortgage that was taken out on this home.
Original Mortgage
$160,000
Interest Rate
7.6%
Mortgage Type
Purchase Money Mortgage
Create a Home Valuation Report for This Property
The Home Valuation Report is an in-depth analysis detailing your home's value as well as a comparison with similar homes in the area
Home Values in the Area
Average Home Value in this Area
Purchase History
| Date | Buyer | Sale Price | Title Company |
|---|---|---|---|
| Harrington Patrick | $350,000 | -- | |
| Caraeff Mcihael R | $200,000 | -- |
Source: Public Records
Mortgage History
| Date | Status | Borrower | Loan Amount |
|---|---|---|---|
| Open | Harrington Patrick | $360,000 | |
| Closed | Mills Warren R | $322,950 | |
| Closed | Harrington Patrick | $340,000 | |
| Closed | Harrington Patrick | $63,720 | |
| Closed | Harrington Patrick | $350,000 | |
| Previous Owner | Caraeff Karen | $35,000 | |
| Previous Owner | Caraeff Karen A | $235,000 | |
| Previous Owner | Mills Warren R | $160,000 | |
| Previous Owner | Mills Warren R | $10,000 |
Source: Public Records
Tax History Compared to Growth
Tax History
| Year | Tax Paid | Tax Assessment Tax Assessment Total Assessment is a certain percentage of the fair market value that is determined by local assessors to be the total taxable value of land and additions on the property. | Land | Improvement |
|---|---|---|---|---|
| 2025 | $8,189 | $738,400 | $461,600 | $276,800 |
| 2024 | $8,010 | $733,500 | $439,700 | $293,800 |
| 2023 | $7,974 | $699,500 | $418,800 | $280,700 |
| 2022 | $7,945 | $637,100 | $418,800 | $218,300 |
| 2021 | $6,973 | $531,100 | $323,200 | $207,900 |
| 2020 | $6,800 | $518,300 | $315,400 | $202,900 |
| 2019 | $6,632 | $503,200 | $306,200 | $197,000 |
| 2018 | $6,205 | $449,300 | $263,200 | $186,100 |
| 2017 | $5,806 | $428,200 | $250,700 | $177,500 |
| 2016 | $5,727 | $424,200 | $250,700 | $173,500 |
| 2015 | $5,608 | $402,300 | $230,900 | $171,400 |
Source: Public Records
Map
Nearby Homes