S
Landlord's Agent in 2021
Sundi Corner
RE/MAX


Estimated Value: $189,000 - $288,000
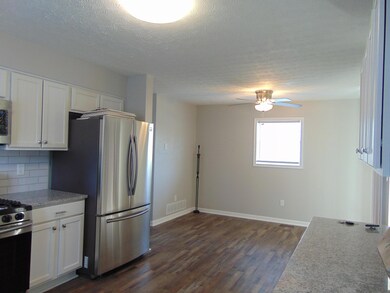
Welcome to 441 Capitol View Dr. near the rapidly developing King-Lincoln neighborhood. With a great location close to highway access, downtown, and OSU East, this totally renovated home is ready to rent. ALL NEW! Updates include a brand new kitchen with granite countertops and stainless steel appliances, new bathrooms with all new fixtures, and luxury vinyl flooring throughout, new doors, new HVAC, vinyl siding, deck, and a new roof-All done in 2019! Repainted and new carpeting installed 2021. This home also features a spacious, bright living room, three sizable bedrooms - with an oversized master, an attached garage with new door & opener, a partially finished basement with another full bath and plenty of storage.
Last Agent to Rent the Property
Sundi Corner
RE/MAX Main Street Listed on: 05/04/2021

Last Renter's Agent
Sundi Corner
RE/MAX Main Street Listed on: 05/04/2021
| Date | Buyer | Sale Price | Title Company |
|---|---|---|---|
| Jones Sheldon | -- | Landsel Title Box | |
| The Secretory Of Hopusing And Urban Deve | -- | None Available | |
| Mb Financial Bank Na | $40,000 | None Available | |
| Mb Financial Bank Na | -- | None Available | |
| Fitz Jernica M | $74,300 | -- | |
| Lynn Ronita | $75,900 | -- | |
| -- | -- | -- |
| Date | Event | Price | List to Sale | Price per Sq Ft | Prior Sale |
|---|---|---|---|---|---|
| 03/31/2025 03/31/25 | Off Market | $1,400 | -- | -- | |
| 03/31/2025 03/31/25 | Off Market | $50,090 | -- | -- | |
| 03/27/2025 03/27/25 | Off Market | $1,400 | -- | -- | |
| 05/06/2021 05/06/21 | Rented | $1,400 | 0.0% | -- | |
| 04/26/2021 04/26/21 | For Rent | $1,400 | 0.0% | -- | |
| 09/16/2019 09/16/19 | Rented | $1,400 | 0.0% | -- | |
| 07/07/2019 07/07/19 | For Rent | $1,400 | 0.0% | -- | |
| 02/23/2018 02/23/18 | Sold | $50,090 | -6.4% | $38 / Sq Ft | View Prior Sale |
| 01/24/2018 01/24/18 | Pending | -- | -- | -- | |
| 12/29/2017 12/29/17 | For Sale | $53,500 | -- | $41 / Sq Ft |
| Year | Tax Paid | Tax Assessment Tax Assessment Total Assessment is a certain percentage of the fair market value that is determined by local assessors to be the total taxable value of land and additions on the property. | Land | Improvement |
|---|---|---|---|---|
| 2024 | $6,003 | $72,740 | $18,870 | $53,870 |
| 2023 | $3,292 | $72,740 | $18,870 | $53,870 |
| 2022 | $1,262 | $21,670 | $1,510 | $20,160 |
| 2021 | $1,514 | $21,670 | $1,510 | $20,160 |
| 2020 | $1,305 | $21,670 | $1,510 | $20,160 |
| 2019 | $1,312 | $18,060 | $1,260 | $16,800 |
| 2018 | $1,159 | $18,030 | $1,260 | $16,770 |
| 2017 | $1,254 | $18,030 | $1,260 | $16,770 |
| 2016 | $1,204 | $18,170 | $4,800 | $13,370 |
| 2015 | $1,093 | $18,170 | $4,800 | $13,370 |
| 2014 | $1,095 | $18,170 | $4,800 | $13,370 |
| 2013 | $568 | $19,110 | $5,040 | $14,070 |
S
Landlord's Agent in 2021
Sundi Corner
RE/MAX
J
Seller's Agent in 2018
Joe Armeni
RE/MAX
Source: Columbus and Central Ohio Regional MLS
MLS Number: 221014181
APN: 010-224150
Disclaimer: Certain information contained herein is derived from information provided by parties other than Homes.com. All information provided is deemed reliable, but is not guaranteed to be accurate and should be independently verified.
![]() IDX information is provided exclusively for personal, non-commercial use, and may not be used for any purpose other than to identify prospective properties consumers may be interested in purchasing.
IDX information is provided exclusively for personal, non-commercial use, and may not be used for any purpose other than to identify prospective properties consumers may be interested in purchasing.
Information is deemed reliable but not guaranteed.