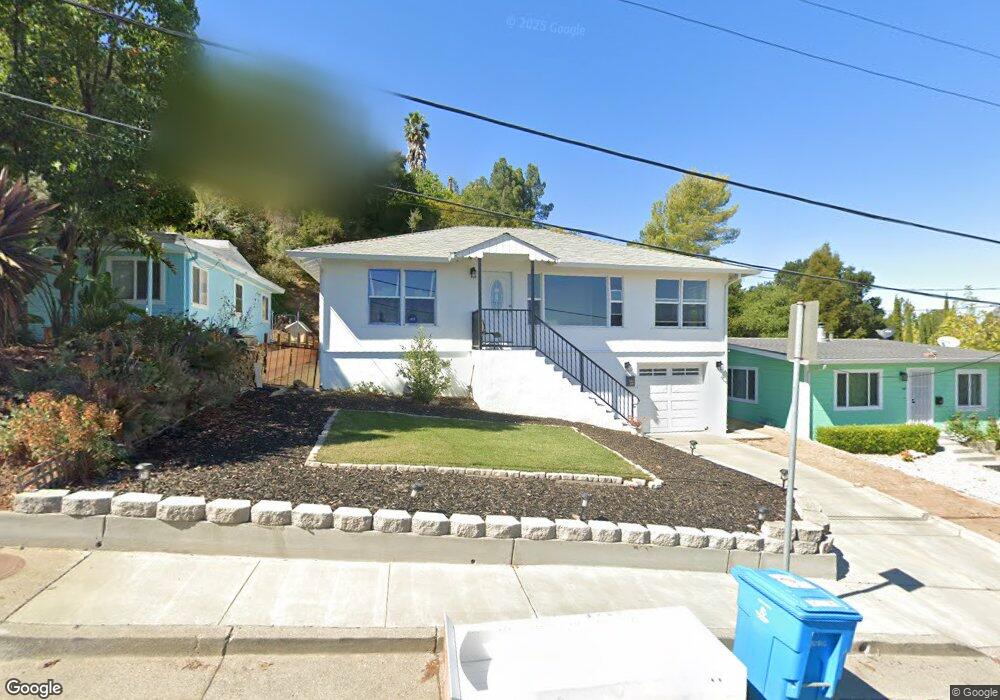
441 Carter St Vallejo, CA 94590
Vallejo Heights NeighborhoodEstimated Value: $417,000 - $528,000
3
Beds
1
Bath
1,200
Sq Ft
$402/Sq Ft
Est. Value
About This Home
This home is located at 441 Carter St, Vallejo, CA 94590 and is currently estimated at $482,054, approximately $401 per square foot. 441 Carter St is a home located in Solano County with nearby schools including Mare Island Health And Fitness Academy, Vallejo High School, and Caliber: ChangeMakers Academy.
Ownership History
Date
Name
Owned For
Owner Type
Purchase Details
Closed on
Apr 2, 2021
Sold by
Dent Kenneth E
Bought by
Lizarrage-Dent Susan
Current Estimated Value
Purchase Details
Closed on
Jan 25, 2017
Sold by
Dent Susan Lizarraga and Dent Kenneth
Bought by
Dent Susan Lizarraga and Dent Kenneth
Home Financials for this Owner
Home Financials are based on the most recent Mortgage that was taken out on this home.
Original Mortgage
$136,150
Interest Rate
3%
Mortgage Type
Adjustable Rate Mortgage/ARM
Purchase Details
Closed on
Jul 11, 2008
Sold by
Hernandez Janet
Bought by
Lizarraga Susan and Dent Kenneth
Home Financials for this Owner
Home Financials are based on the most recent Mortgage that was taken out on this home.
Original Mortgage
$96,000
Interest Rate
5.75%
Mortgage Type
Purchase Money Mortgage
Create a Home Valuation Report for This Property
The Home Valuation Report is an in-depth analysis detailing your home's value as well as a comparison with similar homes in the area
Home Values in the Area
Average Home Value in this Area
Purchase History
| Date | Buyer | Sale Price | Title Company |
|---|---|---|---|
| Lizarrage-Dent Susan | -- | -- | |
| Dent Susan Lizarraga | -- | Fidelity National Title Co | |
| Lizarraga Susan | $120,000 | First American Title Company |
Source: Public Records
Mortgage History
| Date | Status | Borrower | Loan Amount |
|---|---|---|---|
| Previous Owner | Dent Susan Lizarraga | $136,150 | |
| Previous Owner | Lizarraga Susan | $96,000 |
Source: Public Records
Tax History
| Year | Tax Paid | Tax Assessment Tax Assessment Total Assessment is a certain percentage of the fair market value that is determined by local assessors to be the total taxable value of land and additions on the property. | Land | Improvement |
|---|---|---|---|---|
| 2025 | $2,798 | $157,609 | $65,669 | $91,940 |
| 2024 | $2,798 | $154,520 | $64,382 | $90,138 |
| 2023 | $2,598 | $151,491 | $63,120 | $88,371 |
| 2022 | $2,490 | $148,522 | $61,884 | $86,638 |
| 2021 | $2,432 | $145,611 | $60,671 | $84,940 |
| 2020 | $2,424 | $144,119 | $60,049 | $84,070 |
| 2019 | $2,332 | $141,294 | $58,872 | $82,422 |
| 2018 | $2,170 | $138,524 | $57,718 | $80,806 |
| 2017 | $2,055 | $135,809 | $56,587 | $79,222 |
| 2016 | $1,482 | $133,147 | $55,478 | $77,669 |
| 2015 | $1,462 | $131,148 | $54,645 | $76,503 |
| 2014 | $1,441 | $128,580 | $53,575 | $75,005 |
Source: Public Records
Map
Nearby Homes
- 110 Harrier Ave
- 112 Harrier Ave
- 25 Burnham St
- 61 Parrott St
- 178 Baxter St
- 516 Hichborn St
- 116 Mississippi St
- 19 Parrott St
- 1513 Santa Clara St
- 8 Missouri St
- 2008 Marin St
- 220 Nigh St
- 230 Mississippi St
- 15 Saint Francis Dr
- 124 Illinois St
- 240 Mississippi St
- 22 Saint Francis Dr
- 0 Mississippi St
- 0 Hichborn St Unit 41122570
- 2269 Sacramento St
Your Personal Tour Guide
Ask me questions while you tour the home.