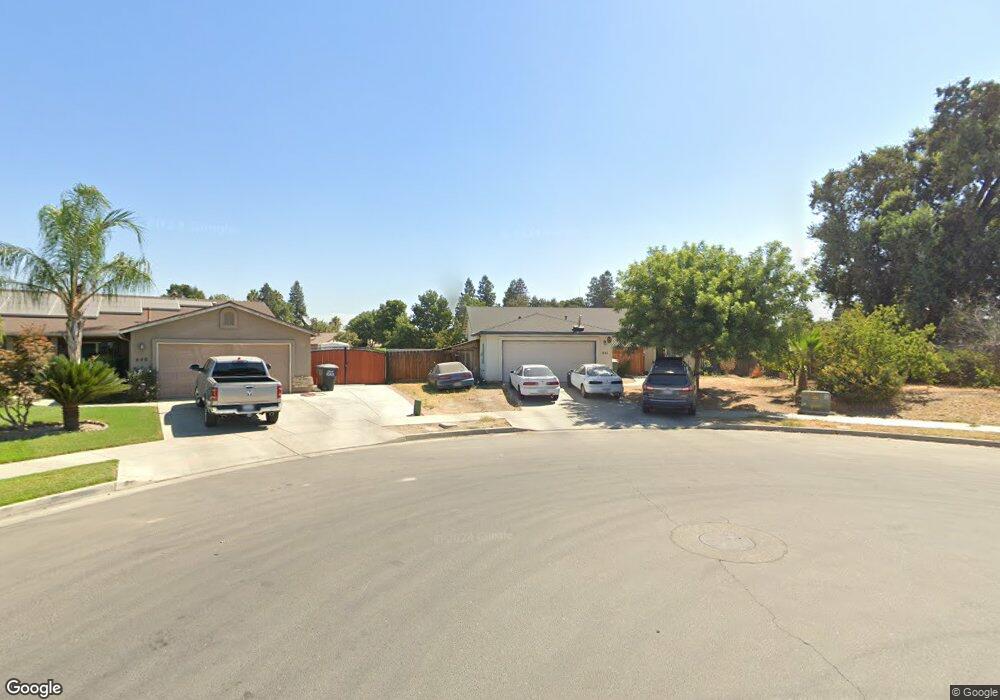
441 E Riverbend Ct Visalia, CA 93291
North Visalia NeighborhoodEstimated Value: $349,000 - $412,000
About This Home
This home is located at 441 E Riverbend Ct, Visalia, CA 93291 and is currently estimated at $381,991, approximately $219 per square foot. 441 E Riverbend Ct is a home located in Tulare County with nearby schools including Crowley Elementary School, Divisadero Middle School, and Mt. Whitney High School.
Ownership History
We collect this data history from publicly available records. To have your information removed, we recommend requesting removal directly through your county’s website.
Purchase Details
Home Financials for this Owner
Home Financials are based on the most recent Mortgage that was taken out on this home.Home Values in the Area
Average Home Value in this Area
Purchase History
We collect this data history from publicly available records. To have your information removed, we recommend requesting removal directly through your county’s website.
| Date | Buyer | Sale Price | Title Company |
|---|---|---|---|
| $140,000 | Chicago Title Company |
Mortgage History
We collect this data history from publicly available records. To have your information removed, we recommend requesting removal directly through your county’s website.
| Date | Status | Borrower | Loan Amount |
|---|---|---|---|
| Closed | $4,087 | ||
| Closed | $136,451 | ||
| Closed | $330,000 |
Tax History
We collect this data history from publicly available records. To have your information removed, we recommend requesting removal directly through your county’s website.
| Year | Tax Paid | Tax Assessment Tax Assessment Total Assessment is a certain percentage of the fair market value that is determined by local assessors to be the total taxable value of land and additions on the property. | Land | Improvement |
|---|---|---|---|---|
| 2025 | $2,297 | $175,845 | $37,680 | $138,165 |
| 2024 | $2,297 | $172,398 | $36,942 | $135,456 |
| 2023 | $2,246 | $169,018 | $36,218 | $132,800 |
| 2022 | $2,165 | $165,705 | $35,508 | $130,197 |
| 2021 | $2,167 | $162,456 | $34,812 | $127,644 |
| 2020 | $2,151 | $160,790 | $34,455 | $126,335 |
| 2019 | $2,110 | $157,637 | $33,779 | $123,858 |
| 2018 | $2,060 | $154,546 | $33,117 | $121,429 |
| 2017 | $2,045 | $151,516 | $32,468 | $119,048 |
| 2016 | $1,790 | $148,545 | $31,831 | $116,714 |
| 2015 | $1,725 | $146,314 | $31,353 | $114,961 |
| 2014 | $1,725 | $143,448 | $30,739 | $112,709 |
Map
- 1032 E Oakridge Ave
- 3935 E Oakridge Ave
- 3929 E Oakridge Ave
- 3945 E Oakridge Ave
- 332 E Porter Ave
- 2500 N Charter Oak Ct
- 1919 N Bridge St
- 2234 N Edison St
- 31345 Road 132
- 1217 E Ferguson Ave
- 1205 E Ferguson Ave
- 0 W Ferguson Ave Unit 214901
- 3707 N Santa fe St
- 13079 Karolina Dr
- 733 W Perez Ave
- 3733 N Clay St
- 807 E Harold Ave
- 420 E Newton Ave
- 324 E Newton Ave
- 3742 N Encina Ct
- 445 E Wren Ave
- 439 E Wren Ave
- 440 E Riverbend Ct
- 433 E Wren Ave
- 2704 N Clay Ct
- 430 E Riverbend Ct
- 504 E Dove Ct
- 421 E Wren Ave
- 2712 N Clay Ct
- 422 E Riverbend Ct
- 500 E Dove Ct
- 503 E Lark Ave
- 2705 N Clay Ct
- 510 E Dove Ct
- 2707 N Thomas St
- 2722 N Clay Ct
- 2910 N Clay Ct
- 2713 N Clay Ct
- 431 E Riverbend Ct
- 511 E Lark Ave
Ask me questions while you tour the home.