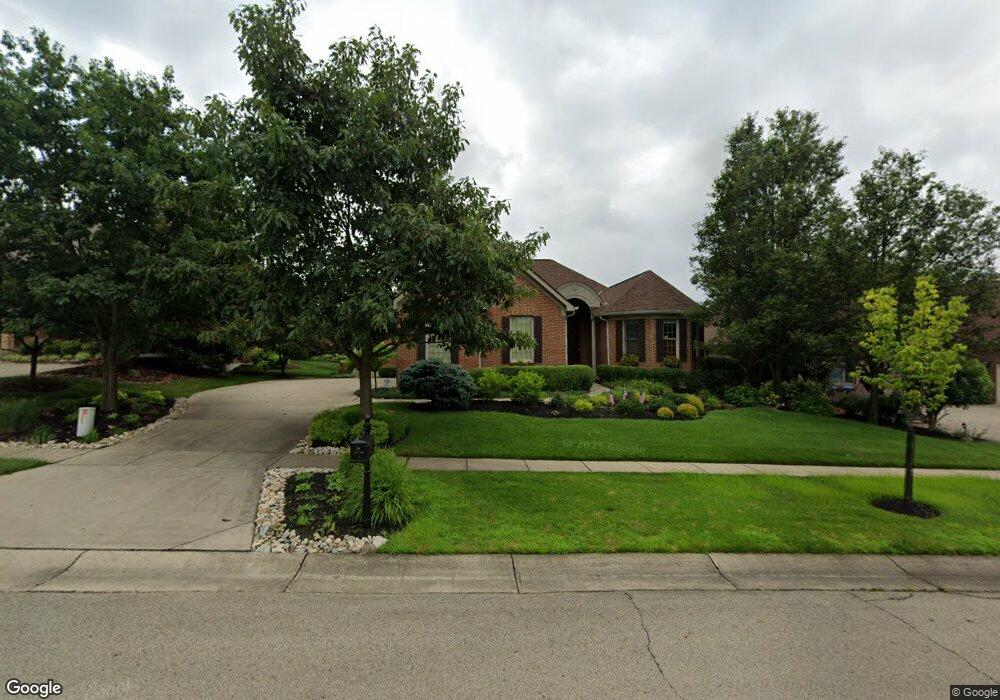
441 Fox Chapel Run Maineville, OH 45039
Estimated Value: $708,556 - $928,000
3
Beds
4
Baths
4,109
Sq Ft
$201/Sq Ft
Est. Value
About This Home
This home is located at 441 Fox Chapel Run, Maineville, OH 45039 and is currently estimated at $827,389, approximately $201 per square foot. 441 Fox Chapel Run is a home located in Warren County with nearby schools including Kings Junior High School and Kings High School.
Ownership History
Date
Name
Owned For
Owner Type
Purchase Details
Closed on
Feb 4, 2025
Sold by
Sampson Sally E
Bought by
Sally Sampson Trust and Sampson
Current Estimated Value
Purchase Details
Closed on
Oct 3, 2011
Sold by
Somerset Custom Homes Inc
Bought by
Sampson Howard B and Sampson Sally E
Home Financials for this Owner
Home Financials are based on the most recent Mortgage that was taken out on this home.
Original Mortgage
$360,000
Interest Rate
4.23%
Mortgage Type
New Conventional
Purchase Details
Closed on
Apr 25, 2005
Sold by
Brandenburg Development Co Llc
Bought by
Somerset Custom Homes Inc
Home Financials for this Owner
Home Financials are based on the most recent Mortgage that was taken out on this home.
Original Mortgage
$625,000
Interest Rate
6.13%
Mortgage Type
Fannie Mae Freddie Mac
Create a Home Valuation Report for This Property
The Home Valuation Report is an in-depth analysis detailing your home's value as well as a comparison with similar homes in the area
Home Values in the Area
Average Home Value in this Area
Purchase History
| Date | Buyer | Sale Price | Title Company |
|---|---|---|---|
| Sally Sampson Trust | -- | None Listed On Document | |
| Sampson Howard B | $450,000 | Prodigy Title | |
| Somerset Custom Homes Inc | $110,000 | -- |
Source: Public Records
Mortgage History
| Date | Status | Borrower | Loan Amount |
|---|---|---|---|
| Previous Owner | Sampson Howard B | $360,000 | |
| Previous Owner | Somerset Custom Homes Inc | $625,000 |
Source: Public Records
Tax History
| Year | Tax Paid | Tax Assessment Tax Assessment Total Assessment is a certain percentage of the fair market value that is determined by local assessors to be the total taxable value of land and additions on the property. | Land | Improvement |
|---|---|---|---|---|
| 2025 | $8,821 | $207,560 | $49,590 | $157,970 |
| 2024 | $8,821 | $207,560 | $49,590 | $157,970 |
| 2023 | $7,723 | $163,243 | $38,762 | $124,481 |
| 2022 | $7,637 | $163,244 | $38,763 | $124,481 |
| 2021 | $7,281 | $163,244 | $38,763 | $124,481 |
| 2020 | $8,252 | $158,484 | $37,632 | $120,852 |
| 2019 | $8,390 | $158,484 | $37,632 | $120,852 |
| 2018 | $8,157 | $158,484 | $37,632 | $120,852 |
| 2017 | $7,999 | $155,267 | $37,433 | $117,835 |
| 2016 | $8,190 | $155,267 | $37,433 | $117,835 |
| 2015 | $8,183 | $155,267 | $37,433 | $117,835 |
| 2014 | $9,257 | $155,270 | $37,430 | $117,830 |
| 2013 | $9,046 | $183,650 | $44,280 | $139,370 |
Source: Public Records
Map
Nearby Homes
- 427 Glen Abbey Ln
- 397 Glen Abbey Ln
- 379 Glen Abbey Ln
- 580 Winding River Blvd
- 367 Glen Abbey Ln
- 4984 Water Stone Ln
- 931 Turning Point Ln
- 884 River Forest Dr
- 961 River Forest Dr
- 0 Deere Run Ln Unit 1836428
- 120 Ridgeview Ln
- 122 Deere Run Ln
- 98 Bedles Ct
- 5365 Station Dr
- 922 Trovillo Dr
- 5259 Little Turtle Dr
- 219 Chateau Valley Ln
- 329 Stone Ridge Blvd
- 4825 Lakeview Ct
- 1099 Grandin Pond Dr
- 435 Fox Chapel Run
- 447 Fox Chapel Run
- 453 Fox Chapel Run
- 429 Fox Chapel Run
- 440 Glen Abbey Ln
- 5187 Emerald View Dr
- 5139 Emerald View Dr
- 448 Fox Chapel Run
- 423 Fox Chapel Run
- 439 Fox Chapel Run
- 442 Fox Chapel Run
- 65 Emerald View Dr Unit 65
- 27 Emerald View Dr
- 436 Fox Chapel Run
- 245 Grand Legacy Dr
- 0 Grand Legacy Dr Unit 220
- 218 Grand Legacy Dr
- 217 Grand Legacy Dr
- 220 Grand Legacy Dr
- 430 Fox Chapel Run
Your Personal Tour Guide
Ask me questions while you tour the home.