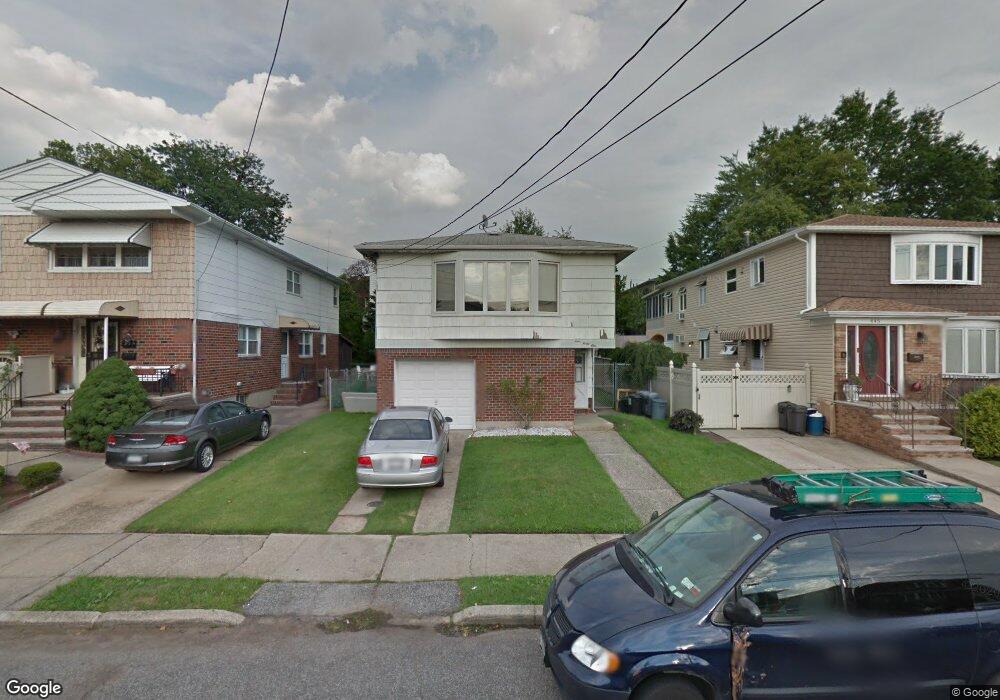
441 Livermore Ave Staten Island, NY 10314
Westerleigh NeighborhoodEstimated Value: $781,000 - $833,652
5
Beds
2
Baths
1,856
Sq Ft
$435/Sq Ft
Est. Value
About This Home
This home is located at 441 Livermore Ave, Staten Island, NY 10314 and is currently estimated at $807,913, approximately $435 per square foot. 441 Livermore Ave is a home located in Richmond County with nearby schools including P.S. 30 Westerleigh, I.S. 51 Edwin Markham, and Port Richmond High School.
Ownership History
Date
Name
Owned For
Owner Type
Purchase Details
Closed on
Dec 15, 2010
Sold by
Mulraney Susan and The Estate Of Robert E Hanson
Bought by
Romeo Angela and Romeo Jason
Current Estimated Value
Home Financials for this Owner
Home Financials are based on the most recent Mortgage that was taken out on this home.
Original Mortgage
$280,000
Outstanding Balance
$186,678
Interest Rate
4.4%
Mortgage Type
New Conventional
Estimated Equity
$621,235
Purchase Details
Closed on
Jun 18, 2001
Sold by
Hanson John G
Bought by
Hanson John G and Hanson Robert E
Home Financials for this Owner
Home Financials are based on the most recent Mortgage that was taken out on this home.
Original Mortgage
$210,000
Interest Rate
7.2%
Purchase Details
Closed on
Mar 15, 2000
Sold by
Hanson Mary and Meyer John
Bought by
Hanson John G
Purchase Details
Closed on
Jan 10, 1999
Sold by
Hanson John J and Hanson Mary
Bought by
Hanson Mary and Meyer John
Create a Home Valuation Report for This Property
The Home Valuation Report is an in-depth analysis detailing your home's value as well as a comparison with similar homes in the area
Home Values in the Area
Average Home Value in this Area
Purchase History
| Date | Buyer | Sale Price | Title Company |
|---|---|---|---|
| Romeo Angela | $420,000 | The Judicial Title Insurance | |
| Hanson John G | -- | -- | |
| Hanson John G | -- | -- | |
| Hanson Mary | -- | -- |
Source: Public Records
Mortgage History
| Date | Status | Borrower | Loan Amount |
|---|---|---|---|
| Open | Romeo Angela | $280,000 | |
| Previous Owner | Hanson John G | $210,000 |
Source: Public Records
Tax History Compared to Growth
Tax History
| Year | Tax Paid | Tax Assessment Tax Assessment Total Assessment is a certain percentage of the fair market value that is determined by local assessors to be the total taxable value of land and additions on the property. | Land | Improvement |
|---|---|---|---|---|
| 2025 | $7,632 | $39,360 | $16,170 | $23,190 |
| 2024 | $7,644 | $41,700 | $14,399 | $27,301 |
| 2023 | $7,713 | $39,380 | $14,330 | $25,050 |
| 2022 | $7,130 | $39,000 | $15,240 | $23,760 |
| 2021 | $7,319 | $37,380 | $15,240 | $22,140 |
| 2020 | $7,070 | $35,940 | $15,240 | $20,700 |
| 2019 | $6,575 | $36,060 | $15,240 | $20,820 |
| 2018 | $6,392 | $32,817 | $14,572 | $18,245 |
| 2017 | $6,012 | $30,960 | $15,240 | $15,720 |
| 2016 | $5,723 | $30,180 | $15,240 | $14,940 |
| 2015 | $4,946 | $29,001 | $16,589 | $12,412 |
| 2014 | $4,946 | $27,360 | $16,920 | $10,440 |
Source: Public Records
Map
Nearby Homes
- 523 Woolley Ave
- 36 Carmel Ave
- 422 Crystal Ave
- 49 Sheraden Ave
- 366 Neal Dow Ave
- 101 Delmore St
- 26 Iowa Place
- 53 Carmel Ave
- 279 Collfield Ave
- 267 Purdy Ave
- 497 Ingram Ave
- 202 Watchogue Rd
- 97 Martin Ave
- 124 Byrne Ave
- 591 Woolley Ave
- 592 Woolley Ave
- 2111 Victory Blvd
- 63 Avon Ln
- 292 Woolley Ave
- 290 Woolley Ave
- 437 Livermore Ave
- 445 Livermore Ave
- 433 Livermore Ave
- 449 Livermore Ave
- 30 Harvey Ave
- 26 Harvey Ave
- 36 Harvey Ave
- 429 Livermore Ave
- 22 Harvey Ave
- 455 Livermore Ave
- 455 Livermore Ave Unit 1F
- 455 Livermore Ave Unit 2F
- 40 Harvey Ave
- 18 Harvey Ave
- 446 Livermore Ave
- 450 Livermore Ave
- 425 Livermore Ave
- 442 Livermore Ave
- 456 Livermore Ave
- 457 Livermore Ave