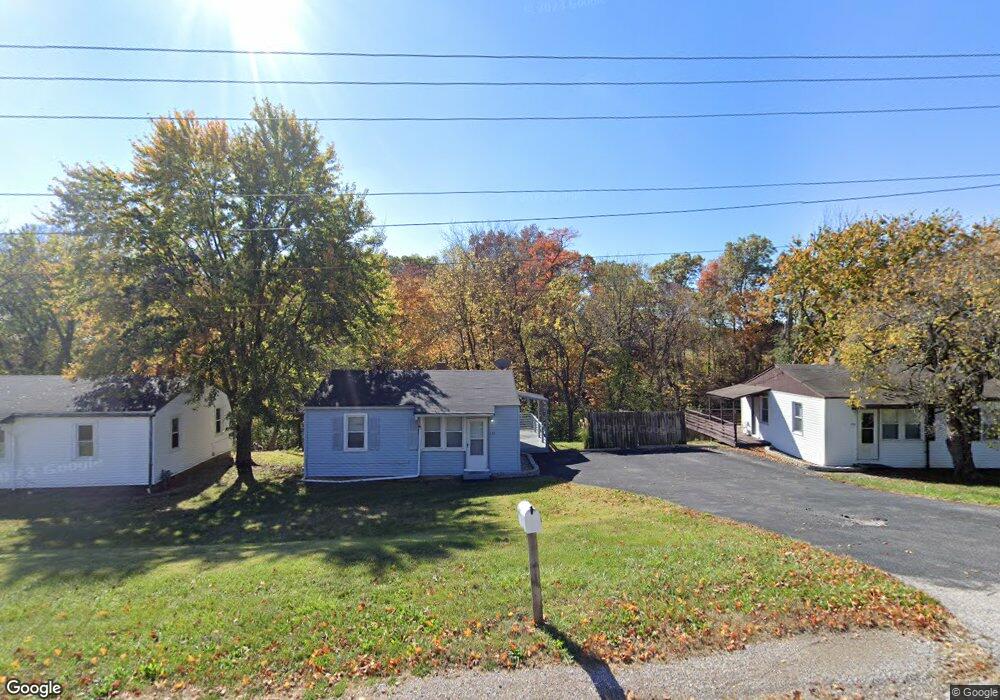
441 Maple St O Fallon, IL 62269
Estimated Value: $80,000 - $116,315
Studio
--
Bath
672
Sq Ft
$151/Sq Ft
Est. Value
About This Home
This home is located at 441 Maple St, O Fallon, IL 62269 and is currently estimated at $101,579, approximately $151 per square foot. 441 Maple St is a home located in St. Clair County with nearby schools including Shiloh Elementary School, Shiloh Middle School, and O'Fallon Township High School.
Ownership History
Date
Name
Owned For
Owner Type
Purchase Details
Closed on
Oct 1, 2004
Sold by
Still Waters Corp
Bought by
Randolph Kris and Randolph Susan
Current Estimated Value
Home Financials for this Owner
Home Financials are based on the most recent Mortgage that was taken out on this home.
Original Mortgage
$28,000
Interest Rate
5.93%
Mortgage Type
Purchase Money Mortgage
Purchase Details
Closed on
Nov 21, 2002
Sold by
West Pointe Bank & Trust Company
Bought by
Still Waters Corp and Scott Trust #1986
Create a Home Valuation Report for This Property
The Home Valuation Report is an in-depth analysis detailing your home's value as well as a comparison with similar homes in the area
Home Values in the Area
Average Home Value in this Area
Purchase History
| Date | Buyer | Sale Price | Title Company |
|---|---|---|---|
| Randolph Kris | $35,000 | First County | |
| Still Waters Corp | -- | First County Title |
Source: Public Records
Mortgage History
| Date | Status | Borrower | Loan Amount |
|---|---|---|---|
| Closed | Randolph Kris | $28,000 |
Source: Public Records
Tax History
| Year | Tax Paid | Tax Assessment Tax Assessment Total Assessment is a certain percentage of the fair market value that is determined by local assessors to be the total taxable value of land and additions on the property. | Land | Improvement |
|---|---|---|---|---|
| 2024 | $1,816 | $24,490 | $2,780 | $21,710 |
| 2023 | $1,472 | $19,409 | $2,698 | $16,711 |
| 2022 | $1,414 | $18,078 | $2,513 | $15,565 |
| 2021 | $1,321 | $17,000 | $2,363 | $14,637 |
| 2020 | $1,363 | $16,045 | $2,230 | $13,815 |
| 2019 | $1,471 | $17,632 | $2,315 | $15,317 |
| 2018 | $1,446 | $17,129 | $2,249 | $14,880 |
| 2017 | $1,531 | $16,326 | $2,144 | $14,182 |
| 2016 | $1,649 | $18,949 | $5,036 | $13,913 |
| 2014 | $1,687 | $21,024 | $5,300 | $15,724 |
| 2013 | $1,641 | $21,307 | $5,371 | $15,936 |
Source: Public Records
Map
Nearby Homes
- 347 Tamarack Ln
- 4132 Lebanon Ave
- 3830 Breezy Hill
- 1709 Fairway Dr
- 1010 Hawthorne Place
- 1606 Fairway Dr
- 1018 Timber Creek Ln
- 1033 Woods Way
- 906 Hawthorne Place
- 1521 Royal Oak Ct
- 1405 Royal Oak Ct
- 1516 Royal Oak Ct
- 501 Master Ct
- 500 Master Ct
- 601 Dartmouth Dr
- 712 Oak Hollow Ct
- 3719 Thicket Dr
- 3740 Golfview Cir
- 508 Dartmouth Dr
- 3736 Golfview Cir
Your Personal Tour Guide
Ask me questions while you tour the home.