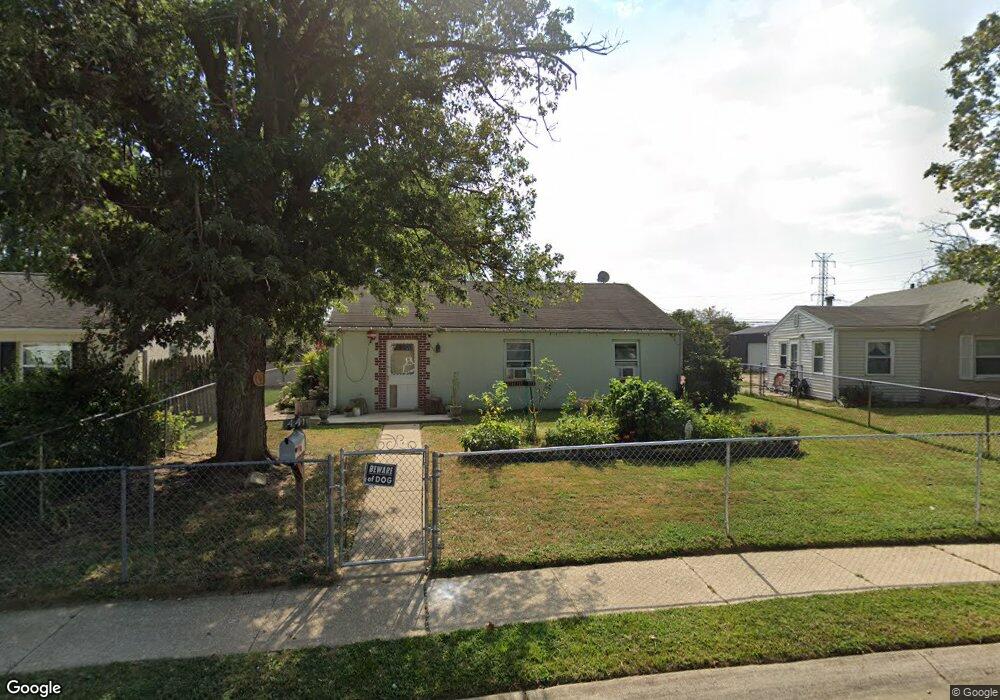
441 Martin Dr New Castle, DE 19720
Estimated Value: $227,000 - $254,348
3
Beds
1
Bath
1,008
Sq Ft
$238/Sq Ft
Est. Value
About This Home
This home is located at 441 Martin Dr, New Castle, DE 19720 and is currently estimated at $239,587, approximately $237 per square foot. 441 Martin Dr is a home located in New Castle County with nearby schools including New Castle Elementary School, Calvin R. McCullough Middle School, and Charter School of New Castle.
Ownership History
Date
Name
Owned For
Owner Type
Purchase Details
Closed on
Dec 30, 2002
Sold by
Metropolitan Properties Group
Bought by
Magana Jaime and Magana Angelita
Current Estimated Value
Home Financials for this Owner
Home Financials are based on the most recent Mortgage that was taken out on this home.
Original Mortgage
$89,900
Outstanding Balance
$38,827
Interest Rate
6.19%
Mortgage Type
Purchase Money Mortgage
Estimated Equity
$200,760
Purchase Details
Closed on
Jul 12, 2002
Sold by
Federal Home Loan Mortgage Corporation
Bought by
Metropolitan Properties Group
Purchase Details
Closed on
Jun 3, 2002
Sold by
Cavender Irma and Smith Diane L
Bought by
Hsbc Bank Usa
Create a Home Valuation Report for This Property
The Home Valuation Report is an in-depth analysis detailing your home's value as well as a comparison with similar homes in the area
Home Values in the Area
Average Home Value in this Area
Purchase History
| Date | Buyer | Sale Price | Title Company |
|---|---|---|---|
| Magana Jaime | $92,900 | -- | |
| Metropolitan Properties Group | $53,500 | -- | |
| Hsbc Bank Usa | $32,400 | -- |
Source: Public Records
Mortgage History
| Date | Status | Borrower | Loan Amount |
|---|---|---|---|
| Open | Magana Jaime | $89,900 |
Source: Public Records
Tax History Compared to Growth
Tax History
| Year | Tax Paid | Tax Assessment Tax Assessment Total Assessment is a certain percentage of the fair market value that is determined by local assessors to be the total taxable value of land and additions on the property. | Land | Improvement |
|---|---|---|---|---|
| 2024 | $1,033 | $30,100 | $6,100 | $24,000 |
| 2023 | $940 | $30,100 | $6,100 | $24,000 |
| 2022 | $979 | $30,100 | $6,100 | $24,000 |
| 2021 | $978 | $30,100 | $6,100 | $24,000 |
| 2020 | $834 | $30,100 | $6,100 | $24,000 |
| 2019 | $1,393 | $30,100 | $6,100 | $24,000 |
| 2018 | $965 | $30,100 | $6,100 | $24,000 |
| 2017 | $903 | $30,100 | $6,100 | $24,000 |
| 2016 | $807 | $30,100 | $6,100 | $24,000 |
| 2015 | $807 | $30,100 | $6,100 | $24,000 |
| 2014 | $808 | $30,100 | $6,100 | $24,000 |
Source: Public Records
Map
Nearby Homes